Volvo 2002 Annual Report Download - page 69
Download and view the complete annual report
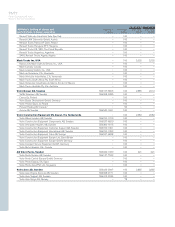
Please find page 69 of the 2002 Volvo annual report below. You can navigate through the pages in the report by either clicking on the pages listed below, or by using the keyword search tool below to find specific information within the annual report.-
 1
1 -
2
-
3
-
4
-
5
-
6
-
7
-
8
-
9
-
10
-
11
-
12
-
13
-
14
-
15
-
16
-
17
-
18
-
19
-
20
-
21
-
22
-
23
-
24
-
25
-
26
-
27
-
28
-
29
-
30
-
31
-
32
-
33
-
34
-
35
-
36
-
37
-
38
-
39
-
40
-
41
-
42
-
43
-
44
-
45
-
46
-
47
-
48
-
49
-
50
-
51
-
52
-
53
-
54
-
55
-
56
-
57
-
58
-
 59
59 -
 60
60 -
 61
61 -
 62
62 -
 63
63 -
 64
64 -
 65
65 -
 66
66 -
 67
67 -
 68
68 -
 69
69 -
 70
70 -
 71
71 -
 72
72 -
 73
73 -
 74
74 -
 75
75 -
 76
76 -
 77
77 -
 78
78 -
 79
79 -
80
-
81
-
82
-
83
-
84
-
85
-
86
-
87
-
88
-
89
-
90
-
91
-
92
-
93
-
94
-
95
-
96
 |
 |
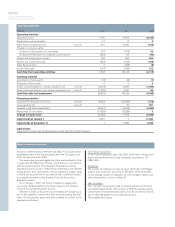
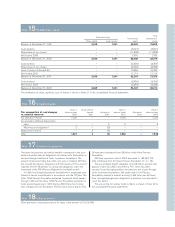
Balance sheets
SEK M Dec 31, 2000 Dec 31, 2001 Dec 31, 2002
Assets
Non-current assets
Rights Note 10 13 0 0
Total intangible assets 13 0 0
Property, plant and equipment Note 10 30 35 31
Total tangible assets 30 35 31
Shares and participations in Group companies Note 11 39,729 38,140 38,950
Long-term receivables with Group companies 761 – –
Other shares and participations Note 11 28,587 26,224 26,168
Other long-term receivables Note 12 266 1,282 2,362
Total financial fixed assets 69,343 65,646 67,480
Total non-current assets 69,386 65,681 67,511
Current assets
Short-term receivables from Group companies 1,590 6,072 2,543
Other short-term receivables Note 13 13,071 524 250
Short-term investments in Group companies Note 14 –17,873 9,045
Cash and bank accounts 7 7 –
Total current assets 14,668 24,476 11,838
Total assets 84,054 90,157 79,349
Shareholders’ equity and liabilities
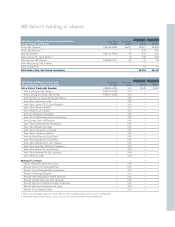
Shareholders’ equity Note 15
Share capital (441,520,885 shares, par value SEK 6) 2,649 2,649 2,649
Legal reserve 7,241 7,241 7,241
Total restricted equity 9,890 9,890 9,890
Unrestricted reserves 51,110 51,150 58,908
Net income 1,376 11,114 (2,485)
Total unrestricted equity 52,486 62,264 56,423
Total shareholders’ equity 62,376 72,154 66,313
Untaxed reserves Note 16 1,527 1,528 1,528
Provisions
Provisions for pensions Note 17 309 342 425
Other provisions Note 18 117 37 41
Total provisions 426 379 466
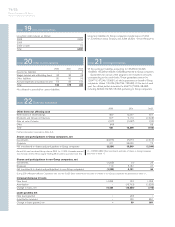
Non-current liabilities Note 19
Liabilities to Group companies 4,230 4,455 4,330
Total non-current liabilities 4,230 4,455 4,330
Current liabilities
Loans from Group companies 14,168 1,800 1,081
Trade payables 38 46 36
Other liabilities to Group companies 1,109 9,616 5,312
Other current liabilities Note 20 180 179 283
Total current liabilities 15,495 11,641 6,712
Total shareholders’ equity and liabilities 84,054 90,157 79,349
Assets pledged – – –
Contingent liabilities Note 21 133,856 150,295 133,330