Volvo 2002 Annual Report Download - page 9
Download and view the complete annual report
Please find page 9 of the 2002 Volvo annual report below. You can navigate through the pages in the report by either clicking on the pages listed below, or by using the keyword search tool below to find specific information within the annual report.-
 1
1 -
 2
2 -
 3
3 -
 4
4 -
 5
5 -
 6
6 -
 7
7 -
 8
8 -
 9
9 -
 10
10 -
 11
11 -
 12
12 -
 13
13 -
 14
14 -
 15
15 -
 16
16 -
 17
17 -
 18
18 -
 19
19 -
 20
20 -
21
-
22
-
23
-
24
-
25
-
26
-
27
-
28
-
29
-
30
-
31
-
32
-
33
-
34
-
35
-
36
-
37
-
38
-
39
-
40
-
41
-
42
-
43
-
44
-
45
-
46
-
47
-
48
-
49
-
50
-
51
-
52
-
53
-
54
-
55
-
56
-
57
-
58
-
59
-
60
-
61
-
62
-
63
-
64
-
65
-
66
-
67
-
68
-
69
-
70
-
71
-
72
-
73
-
74
-
75
-
76
-
77
-
78
-
79
-
80
-
81
-
82
-
83
-
84
-
85
-
86
-
87
-
88
-
89
-
90
-
91
-
92
-
93
-
94
-
95
-
96
 |
 |

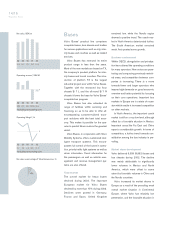
Financial position
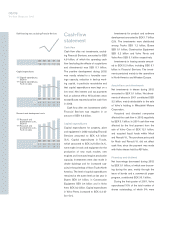
Change in net financial position
SEK bn
December 31, 2001 (7.0)
Cash flow from operating activities 10.4
Investments in fixed assets
and leasing assets, net (5.3)
Investments in shares, net (0.1)
Acquired and divested operations (0.1)
Cash flow after net investments,
excluding Financial Services 4.9
Debt in acquired and divested
operations (0.2)
Dividend paid to AB Volvo’s shareholders (3.4)
Change in provision for
post-employment benefits (3.5)
Currency effect 3.8
Other (0.7)
Total change 0.9
December 31, 2002 (6.1)
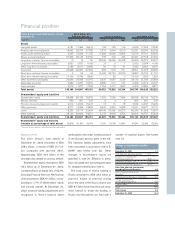
Volvo Group consolidated balance sheets, Volvo Group, excl
December 31 Financial Services 1Financial Services Total Volvo Group
SEK M 2000 2001 2002 2000 2001 2002 2000 2001 2002
Assets
Intangible assets 6,781 17,366 16,919 144 159 126 6,925 17,525 17,045
Property, plant and equipment 19,652 30,370 27,789 2,579 2,864 3,010 22,231 33,234 30,799
Assets under operating leases 4,245 15,020 11,155 11,883 14,060 13,284 14,216 27,101 23,525
Shares and participations 37,366 35,145 34,750 778 203 236 30,481 27,798 27,492
Long-term customer finance receivables 10 19 55 23,026 26,256 25,348 22,909 26,075 25,207
Long-term interest-bearing receivables 5,091 5,627 4,189 23 0 7 5,032 5,554 4,188
Other long-term receivables 2,186 9,017 8,489 90 73 47 2,232 8,902 8,297
Inventories 22,998 30,557 27,564 553 518 741 23,551 31,075 28,305
Short-term customer finance receivables 5 95 44 19,168 23,732 22,700 18,882 22,709 21,791
Short-term interest bearing receivables 14,195 6,799 4,306 1 82 0 14,196 2,525 1,302
Other short-term receivables 22,696 29,798 25,767 2,627 2,647 2,126 24,120 31,044 25,693
Marketable securities 5,682 12,997 16,570 3,886 517 137 9,568 13,514 16,707
Cash and bank 5,276 11,877 7,584 1,764 2,417 1,602 6,400 13,869 8,871
Total assets 146,183 204,687 185,181 66,522 73,528 69,364 200,743 260,925 239,222
Shareholders’ equity and liabilities
Shareholders’ equity 88,338 85,185 78,278 7,663 7,550 7,494 88,338 85,185 78,278
Minority interests 593 391 247 0 0 0 593 391 247
Provision for post-employment benefits 2,619 14,632 16,218 13 15 18 2,632 14,647 16,236
Other provisions 8,277 14,085 13,893 6,620 4,342 2,828 14,941 18,427 16,721
Loans 18,233 29,710 22,494 49,048 57,956 54,270 66,233 81,568 72,437
Other liabilities 28,123 60,684 54,051 3,178 3,665 4,754 28,006 60,707 55,303
Shareholders’ equity and liabilities 146,183 204,687 185,181 66,522 73,528 69,364 200,743 260,925 239,222
Shareholders’ equity and minority
interests as percentage of total assets 60.8% 41.8% 42.4% 11.5% 10.3% 10.8% 44.3% 32.8% 32.8%
1 Financial Services reported in accordance with the equity method.
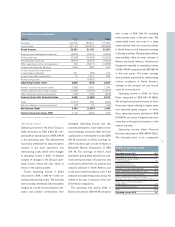
Balance sheet
The Volvo Group’s total assets at
December 31, 2002 amounted to SEK
239.2 billion, a decline of SEK 21.7 bil-
lion compared with year-end 2001.
Approximately SEK 19.4 billion of the
decrease was related to currency effects.
Shareholders’ equity amounted to SEK
78.3 billion as of December 31, 2002,
corresponding to an equity ratio of 42.4%,
excluding Financial Services. Net financial
debt amounted to SEK 6.1 billion, corres-
ponding to 7.7% of shareholders’ equity
and minority interest. At December 31,
2002, minimum liability adjustments were
recognized in Volvo’s balance sheet
attributable to the under funded positions
of the Group’s pension plans in the US.
The minimum liability adjustments have
been calculated in accordance with U.S.
GAAP (see further note 22). Other
changes in shareholders’ equity are
specified in note 21. Effective in 2003,
Volvo will adopt new accounting principles
for employee benefits (see note 1).
The book value of Volvo’s holding in
Scania amounted to SEK 24.0 billion at
year-end. Valued at year-end closing
price, the value of the Scania shares was
SEK 8.7 billion lower than the book value.
Volvo intends to divest the holding in
Scania and discussions are held with a
number of industrial buyers. See further
note 13.