Volvo 2002 Annual Report Download - page 17
Download and view the complete annual report
Please find page 17 of the 2002 Volvo annual report below. You can navigate through the pages in the report by either clicking on the pages listed below, or by using the keyword search tool below to find specific information within the annual report.-
 1
1 -
2
-
3
-
4
-
5
-
6
-
 7
7 -
 8
8 -
 9
9 -
 10
10 -
 11
11 -
 12
12 -
 13
13 -
 14
14 -
 15
15 -
 16
16 -
 17
17 -
 18
18 -
 19
19 -
 20
20 -
 21
21 -
 22
22 -
 23
23 -
 24
24 -
 25
25 -
 26
26 -
 27
27 -
28
-
29
-
30
-
31
-
32
-
33
-
34
-
35
-
36
-
37
-
38
-
39
-
40
-
41
-
42
-
43
-
44
-
45
-
46
-
47
-
48
-
49
-
50
-
51
-
52
-
53
-
54
-
55
-
56
-
57
-
58
-
59
-
60
-
61
-
62
-
63
-
64
-
65
-
66
-
67
-
68
-
69
-
70
-
71
-
72
-
73
-
74
-
75
-
76
-
77
-
78
-
79
-
80
-
81
-
82
-
83
-
84
-
85
-
86
-
87
-
88
-
89
-
90
-
91
-
92
-
93
-
94
-
95
-
96
 |
 |
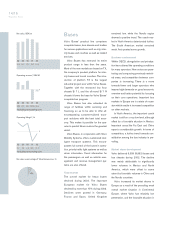
the Nordic region. A positive develop-
ment was noted for Volvo in China and
Southeast Asia. Volvo has lost some mar-
ket share in North America due to the
withdrawal from the US city bus market
and a reduced penetration in Mexico.
The order intake during the second half
of 2002 weakened. At year-end the order
book was 10% lower than in the preced-
ing year. Volvo’s order book improved for
Mexico, Shanghai and Nova/St Eustache.
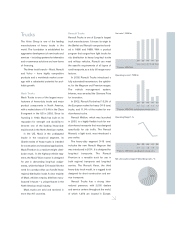
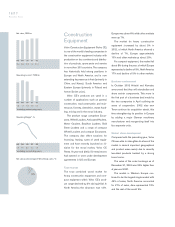
Financial performance
Net sales in 2002 declined to SEK
14,035 M (16,675). The decrease was
largely explained by proportionate
consolidation of Prévost and Nova Bus as
from the fourth quarter 2001 as well as
changes in currency exchange rate.
Adjusted for these effects, net sales was
down 1% pertaining mainly to decreased
deliveries in North and South America
partially offset by favorable volumes in
China and the Nordic countries.
The operating loss was SEK 94 M
compared with an operating loss of SEK
524 M in 2001. The improvement com-
pared with the year-earlier period is to a
large extent due to turn-around activities
in North America and improvements in
Europe and Asia. These positive effects
were partly offset by lower volumes in
Mexico and South America.
Production and investments
During the year Volvo produced 9,113
(10,167) buses and bus chassis, of which
35% were complete buses. The degree
of utilization in the production system in
Europe and North America was affected
by the downturn in the market.
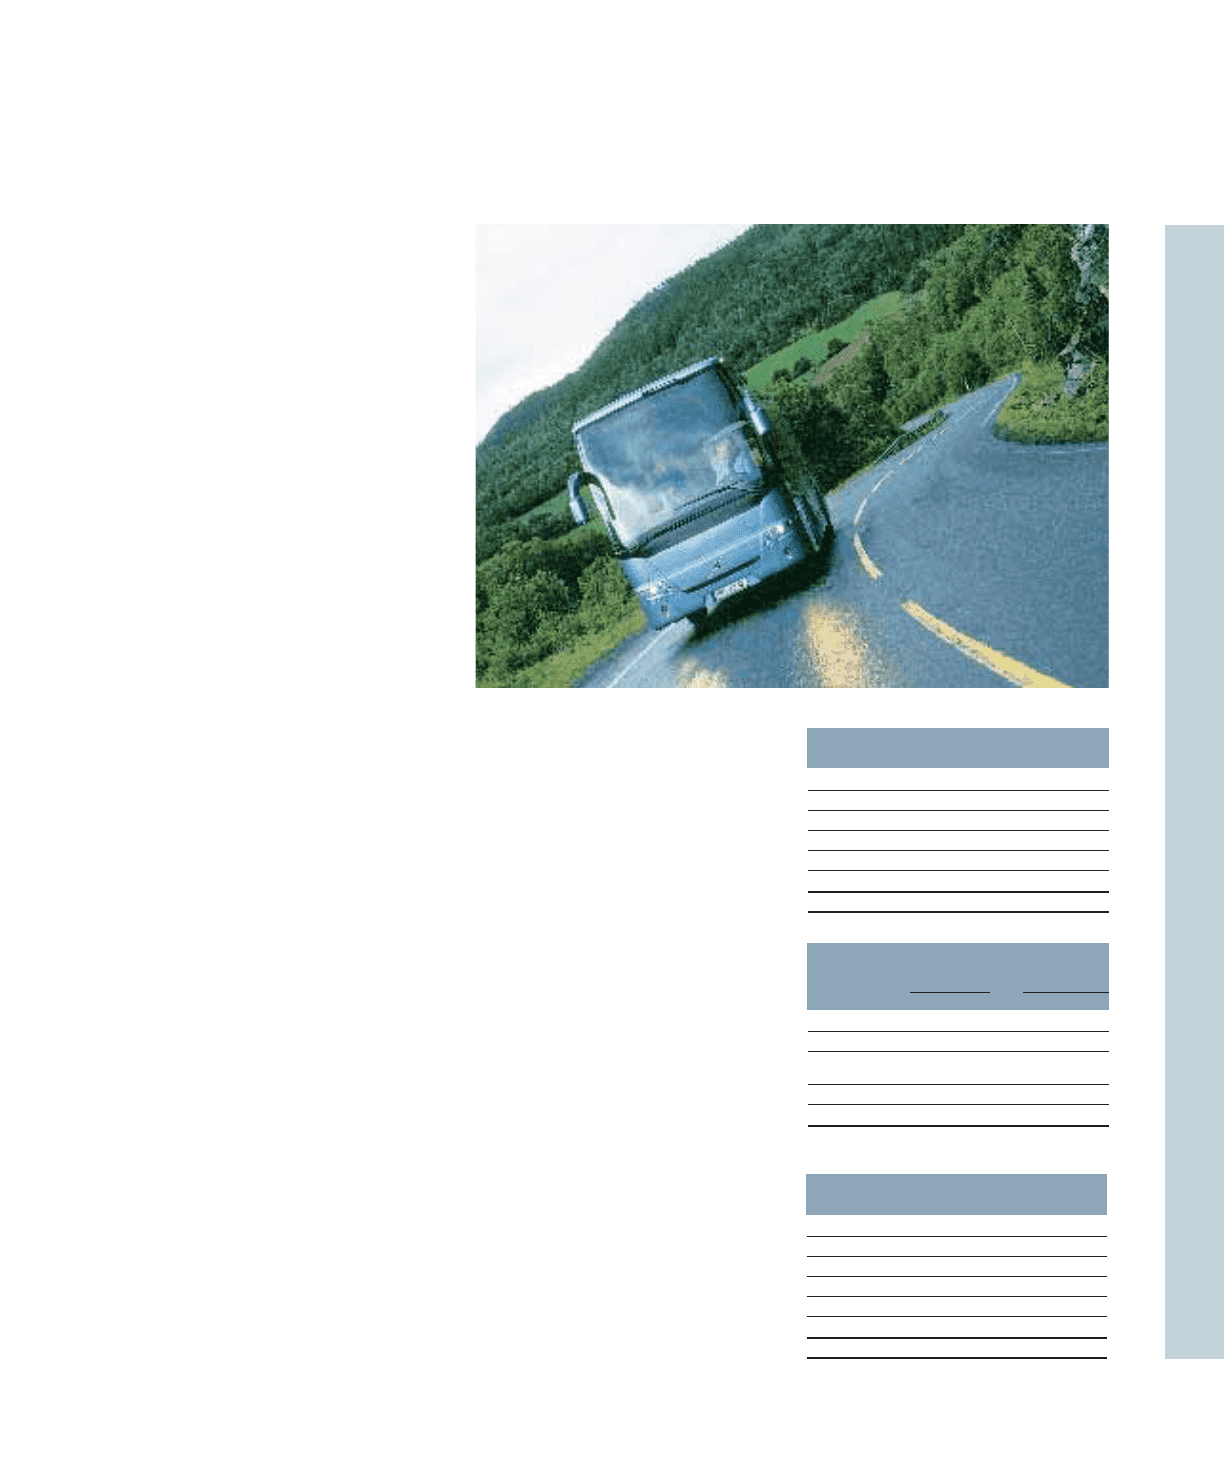
The introduction of the TX-platform
provides Volvo with one of the most mod-
ern product ranges in the bus industry.
This include complete buses and chassis
for city and intercity traffic as well as
coaches, which meet customers and en-
vironmental demands as well as internal
requirements for production efficiency.
Ambitions for 2003
To cope with the developments in the
industry and the market, the process of
optimizing existing strengths and building
for the future continues. Internal produc-
tivity and management programs are
introduced. Cash flow management is a
priority. Product development is focused
on enhanced environmental performance
of the buses.
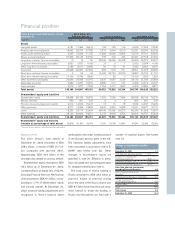
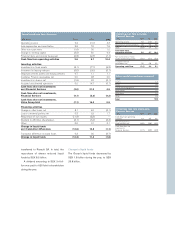
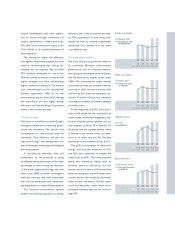
Largest markets Buses
Registered Market share,
buses %
2001 2002 2001 2002
Mexico 1,660 1,101 16.1 12.2
USA and Canada 11,110 1,319 n/a 20
China with
Hong Kong1783 1,004 n/a 5,7
Great Britain 890 1,124 38.7 46.9
Iran 600 600 n/a 60
1 Deliveries from factory.
Number of vehicles invoiced Buses
2000 2001 2002
Western Europe 3,870 2,899 3,076
Eastern Europe 124 216 337
North America 3,869 3,128 1,945
South America 980 1,009 495
Asia 1,659 2,209 2,639
Other markets 513 492 567
Total 11,015 9,953 9,059
Net sales per market Buses
SEKM 2000 2001 2002
Western Europe 6,767 6,263 6,695
Eastern Europe 182 373 409
North America 7,723 6,847 3,838
South America 732 757 366
Asia 1,269 1,839 2,022
Other markets 514 596 705
Total 17,187 16,675 14,035