Volvo 2002 Annual Report Download - page 76
Download and view the complete annual report
Please find page 76 of the 2002 Volvo annual report below. You can navigate through the pages in the report by either clicking on the pages listed below, or by using the keyword search tool below to find specific information within the annual report.-
 1
1 -
2
-
3
-
4
-
5
-
6
-
7
-
8
-
9
-
10
-
11
-
12
-
13
-
14
-
15
-
16
-
17
-
18
-
19
-
20
-
21
-
22
-
23
-
24
-
25
-
26
-
27
-
28
-
29
-
30
-
31
-
32
-
33
-
34
-
35
-
36
-
37
-
38
-
39
-
40
-
41
-
42
-
43
-
44
-
45
-
46
-
47
-
48
-
49
-
50
-
51
-
52
-
53
-
54
-
55
-
56
-
57
-
58
-
59
-
60
-
61
-
62
-
63
-
64
-
65
-
 66
66 -
 67
67 -
 68
68 -
 69
69 -
 70
70 -
 71
71 -
 72
72 -
 73
73 -
 74
74 -
 75
75 -
 76
76 -
 77
77 -
 78
78 -
 79
79 -
 80
80 -
 81
81 -
 82
82 -
 83
83 -
 84
84 -
 85
85 -
 86
86 -
87
-
88
-
89
-
90
-
91
-
92
-
93
-
94
-
95
-
96
 |
 |

74/75
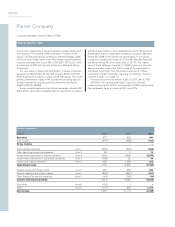
Parent Company AB Volvo
Notes to financial statements
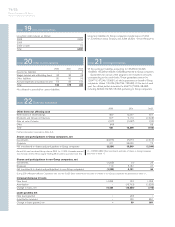
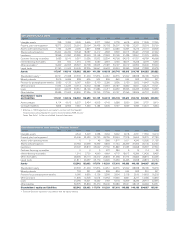
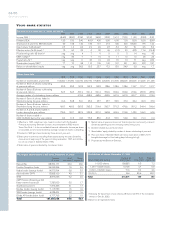
Note 21 Contingent liabilities
Of the contingent liabilities amounting to 133,330 (150,295;
133,856), 133,298 (149,829; 133,548) pertained to Group companies.
Guarantees for various credit programs are included in amounts
corresponding to the credit limits. These guarantees amount to
129,471 (147,246; 130,691), of which guarantees on behalf of Group
companies totaled 129,446 (146,786; 130,686). At the end of each
year, the utilized portion amounted to 69,672 (72,804; 58,448)
including 69,640 (72,793; 58,140) pertaining to Group companies.
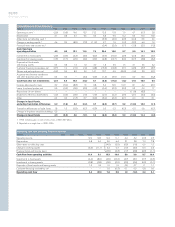
Note 20Other current liabilities
2000 2001 2002
Income tax liabilities – – 6
Wages, salaries and withholding taxes 30 30 38
Other liabilities 95 50 93
Accrued expenses and prepaid income 55 99 146
Total 180 179 283
No collateral is provided for current liabilities.
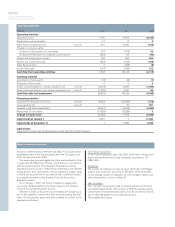
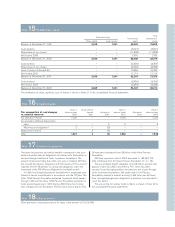
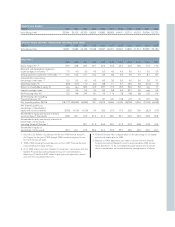
Note 22Cash flow statements
2000 2001 2002
Other items not affecting cash
Write-downs of shareholdings 400 12,237 557
Dividends and Group contributions 507 5,119 (1,408)
Gain on sale of shares (227) (1,047) (32)
Other (49) – 68
Total 631 16,309 (815)
Further information is provided in Note 3–5.
Shares and participations in Group companies, net
Investments (6,675) (7,671) (1,616)
Disposals 411 23,520 72
Net investments in shares and participations in Group companies (6,264) 15,849 (1,544)
Shares and participations in non-Group companies, net
Investments (1,328) (1) 25
Disposals 119 3,182 41
Net investments in shares and participations in non-Group companies (1,209) 3,181 66
Increase/decrease in loans
New loans 14,434 104 1,054
Amortization – (15,763) (1,829)
Change in loans, net 14,434 (15,659) (775)
Loans granted, net
New loans granted –(40) –
Amortization received –100 891
Change in loans granted, net –60891
Note 19 Non-current liabilities
Long-term debt matures as follows:
2004 4,258
2005 –
2006 or later 72
Total 4,330
Long-term liabilities to Group companies include loans of 1,054
(–; 3,104) from Volvo Treasury and 3,204 (3,329; –) from Renault V.I.
Renault V.I. was transferred Group-internal 2001 for 10,700. Proceeds received
from the sale of Volvo Personvagnar Holding AB resulted in a positive cash flow
of – (12,539; 382). Other investments and sales of shares in Group companies
are shown in Note 11.
During 2001 Mitsubishi Motors Corporation was sold for 3,182. Other investments and sales of shares in non-Group companies are presented in Note 11.