Volvo 2002 Annual Report Download - page 42
Download and view the complete annual report
Please find page 42 of the 2002 Volvo annual report below. You can navigate through the pages in the report by either clicking on the pages listed below, or by using the keyword search tool below to find specific information within the annual report.-
 1
1 -
2
-
3
-
4
-
5
-
6
-
7
-
8
-
9
-
10
-
11
-
12
-
13
-
14
-
15
-
16
-
17
-
18
-
19
-
20
-
21
-
22
-
23
-
24
-
25
-
26
-
27
-
28
-
29
-
30
-
31
-
 32
32 -
 33
33 -
 34
34 -
 35
35 -
 36
36 -
 37
37 -
 38
38 -
 39
39 -
 40
40 -
 41
41 -
 42
42 -
 43
43 -
 44
44 -
 45
45 -
 46
46 -
 47
47 -
 48
48 -
 49
49 -
 50
50 -
 51
51 -
 52
52 -
53
-
54
-
55
-
56
-
57
-
58
-
59
-
60
-
61
-
62
-
63
-
64
-
65
-
66
-
67
-
68
-
69
-
70
-
71
-
72
-
73
-
74
-
75
-
76
-
77
-
78
-
79
-
80
-
81
-
82
-
83
-
84
-
85
-
86
-
87
-
88
-
89
-
90
-
91
-
92
-
93
-
94
-
95
-
96
 |
 |

40/41
The Volvo Group
Notes to consolidated financial statements
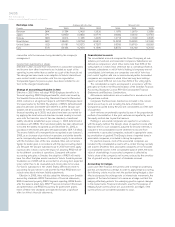
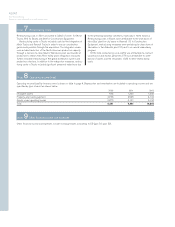
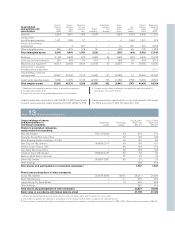
Note 9Other financial income and expenses
Other financial income and expenses include exchange losses amounting to 55 (gain 59; gain 52).
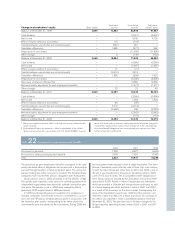
Note 7Restructuring costs
Restructuring costs in 2001 amounted to 3,862 of which 3,106 for
Trucks, 392 for Buses and 364 for Construction Equipment.
Restructuring costs in Trucks included costs for the integration of
Mack Trucks and Renault Trucks in order to secure coordination
gains made possible through the acquisition. The integration meas-
ures included reduction of the North American production capacity
through a decision to close Mack’s Winnsboro plant and transfer of
production to Volvo’s New River Valley plant. Integration measures
further included restructuring of the global distribution system and
production structure. In addition to the integration measures, restruc-
turing costs in Trucks included significant personnel reductions due
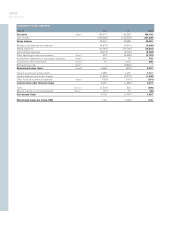
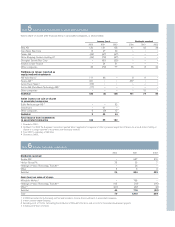
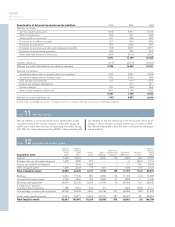
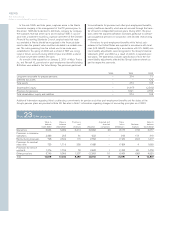
Note 8Operating income (loss)
Operating income (loss) by business area is shown in table in page 4. Depreciation and amortization are included in operating income and are
specified by type of asset as shown below:
2000 2001 2002
Intangible assets 648 1,265 1,586
Property, plant and equipment 2,733 4,545 4,134
Assets under operating leases 2,870 4,151 5,124
Total 6,251 9,961 10,844
to the prevailing business conditions, especially in North America.
Restructuring costs in Buses were attributable to the shut down of
Nova Bus’ plant for city buses in Roswell, US. In Construction
Equipment, restructuring measures were pertaining to close down of
fabrication in the Asheville plant, US, and to an overall redundancy
program.
Of the total restructuring costs, 2,259 was attributable to contract-
ual pensions and excess personnel, 573 was attributable to write-
downs of assets and the remainder, 1,030 to other restructuring
costs.