Volvo 2002 Annual Report Download - page 7
Download and view the complete annual report
Please find page 7 of the 2002 Volvo annual report below. You can navigate through the pages in the report by either clicking on the pages listed below, or by using the keyword search tool below to find specific information within the annual report.-
 1
1 -
 2
2 -
 3
3 -
 4
4 -
 5
5 -
 6
6 -
 7
7 -
 8
8 -
 9
9 -
 10
10 -
 11
11 -
 12
12 -
 13
13 -
 14
14 -
 15
15 -
 16
16 -
 17
17 -
 18
18 -
19
-
20
-
21
-
22
-
23
-
24
-
25
-
26
-
27
-
28
-
29
-
30
-
31
-
32
-
33
-
34
-
35
-
36
-
37
-
38
-
39
-
40
-
41
-
42
-
43
-
44
-
45
-
46
-
47
-
48
-
49
-
50
-
51
-
52
-
53
-
54
-
55
-
56
-
57
-
58
-
59
-
60
-
61
-
62
-
63
-
64
-
65
-
66
-
67
-
68
-
69
-
70
-
71
-
72
-
73
-
74
-
75
-
76
-
77
-
78
-
79
-
80
-
81
-
82
-
83
-
84
-
85
-
86
-
87
-
88
-
89
-
90
-
91
-
92
-
93
-
94
-
95
-
96
 |
 |

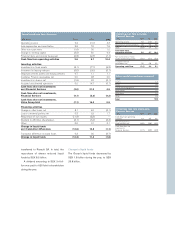
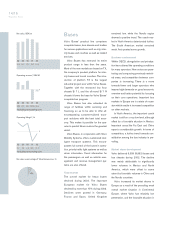
Change of operating income
SEK bn
Operating income 2001 (0.7)
Restructuring costs in 2001 3.9
Improvement of gross margins
in truck operations 1.5
Lower gross income in
Aero due to lower volumes (0.7)
Changes in currency exchange rates 1.2
Lower capitalization of development costs (0.7)
Deficit in Swedish pension foundation (0.5)
Gain on divestments of Volvia’s insurance
operations and shares in Mitsubishi Motors 2001 (1.1)
Credit losses in US truck financing
portfolio 2001 0.7
Lower dividend from Scania (0.3)
Other (0.5)
Operating income 2002 2.8
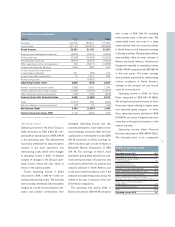
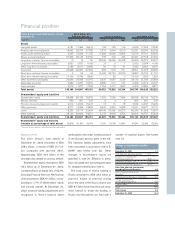
Consolidated income statements 1
SEK M 2000 2001 2002
Net sales 120,392 180,615 177,080
Cost of sales (97,131) (149,477) (145,453)
Gross income 23,261 31,138 31,627
Research and development expenses (4,876) (5,391) (5,869)
Selling expenses (9,285) (14,663) (15,393)
Administrative expenses (4,651) (6,474) (5,464)
Other operating income and expenses 309 (3,071) (2,989)
Income from Financial Services 1,499 325 490
Income (loss) from investments
in associated companies 341 (88) 126
Income from other investments 70 1,410 309
Restructuring costs – (3,862) –
Operating income (loss) 6,668 (676) 2,837
Interest income and similar credits 1,588 1,653 1,246
Interest expenses and similar charges (1,845) (2,653) (1,870)
Other financial income and expenses (165) (190) (200)
Income (loss) after financial items 6,246 (1,866) 2,013
Taxes (1,510) 326 (590)
Minority interests in net income (loss) (27) 73 (30)
Net income (loss) 4,709 (1,467) 1,393
Income (loss) per share, SEK 11.20 (3.50) 3.30
1 Financial Services reported in accordance with the equity method.
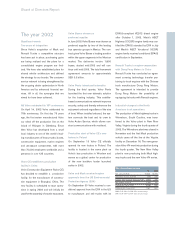
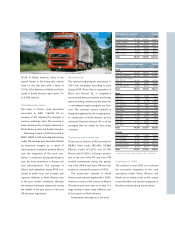
Operating income
Operating income for the Volvo Group in
2002 amounted to SEK 2,837 M, com-
pared with an operating loss of SEK 676 M
in the preceding year. The improvement
was mainly attributable to improved gross
margins in the truck operations and
restructuring costs which were charged
to operating income in 2001. A detailed
analysis of changes in the Group’s oper-
ating income versus the year earlier is
shown in the adjoining table.
Trucks’ operating income in 2002
amounted to SEK 1,189 M (1,040 ex-
cluding restructuring costs). The earnings
were favorably affected by improved gross
margins as a result of improved price real-
ization and positive contributions from
synergies. Operating income was also
positively affected by lower losses on for-
ward exchange contracts offset by lower
capitalization of development costs (SEK
641 M lower than in 2001). Earnings for
2001 included a gain on sale of shares in
Mitsubishi Motors Corporation of SEK
574 M. The earnings of Volvo’s truck
operations during 2002 gained from cont-
inued strong earnings in Europe but also
continued to suffer from low volumes and
capacity utilization in North America due
to the poor market conditions, even if the
demand increased temporarily during the
middle of the year in advance of the new
US emission regulations.
The operating loss during 2002 in
Buses amounted to SEK 94 M compared
with a loss of SEK 524 M, excluding
restructuring costs, in the prior year. The
substantially lower loss was to a large
extent derived from turn around activities
in North America and improved earnings
in Europe and Asia. These positive effects
were partially offset by lower volumes in
Mexico and South America. Construction
Equipment reported an operating income
of SEK 406 M compared with SEK 891 M
in the year earlier. The lower earnings
were primarily explained by deteriorating
market conditions in North America,
changes in the product mix and launch
costs for new products.
Operating income in 2002 for Volvo
Penta amounted to SEK 647 M (658).
The strong financial performance of Volvo
Penta was mainly relating to higher sales
and improved gross margins. In Volvo
Aero, operating income declined to SEK
5 M (653) as a result of significantly lower
sales due to the general downturn in the
aviation industry.
Operating income within Financial
Services amounted to SEK 490 M (325).
The favorable trend of six consecutive