Volvo 2002 Annual Report Download - page 84
Download and view the complete annual report
Please find page 84 of the 2002 Volvo annual report below. You can navigate through the pages in the report by either clicking on the pages listed below, or by using the keyword search tool below to find specific information within the annual report.-
 1
1 -
2
-
3
-
4
-
5
-
6
-
7
-
8
-
9
-
10
-
11
-
12
-
13
-
14
-
15
-
16
-
17
-
18
-
19
-
20
-
21
-
22
-
23
-
24
-
25
-
26
-
27
-
28
-
29
-
30
-
31
-
32
-
33
-
34
-
35
-
36
-
37
-
38
-
39
-
40
-
41
-
42
-
43
-
44
-
45
-
46
-
47
-
48
-
49
-
50
-
51
-
52
-
53
-
54
-
55
-
56
-
57
-
58
-
59
-
60
-
61
-
62
-
63
-
64
-
65
-
66
-
67
-
68
-
69
-
70
-
71
-
72
-
73
-
 74
74 -
 75
75 -
 76
76 -
 77
77 -
 78
78 -
 79
79 -
 80
80 -
 81
81 -
 82
82 -
 83
83 -
 84
84 -
 85
85 -
 86
86 -
 87
87 -
 88
88 -
 89
89 -
 90
90 -
 91
91 -
 92
92 -
 93
93 -
 94
94 -
95
-
96
 |
 |

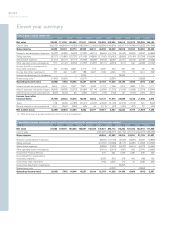
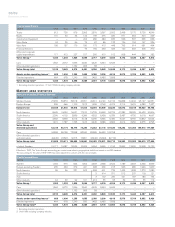
82/83
Eleven-year summary
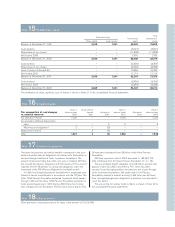
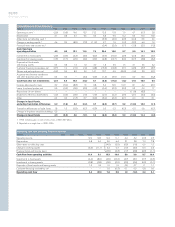
Operating cash flow excluding Financial Services
SEKbn 1992 1993 1994 1995 1996 1997 1998 1999 2000 2001 2002
Operating income 12.9 12.8 12.4 11.1 6.4 5.2 (1.0) 2.3
Depreciation 4.8 4.4 5.0 6.4 3.1 3.8 7.0 7.8
Other items not affecting cash (4.0) (5.5) (0.5) (1.6) 0.0 1.0
Change in working capital (6.3) (11.1) 3.4 0.7 (1.7) (3.0) 6.0 0.4
Financial items and income taxes (0.5) (2.3) (1.7) (0.8) (2.3) (1.1)
Cash flow from operating activities 11.4 6.1 16.3 10.4 5.6 3.6 9.7 10.4
Investments in fixed assets (6.4) (8.0) (9.5) (10.2) (4.7) (5.1) (7.7) (6.3)
Investments in leasing assets (0.8) (0.8) (0.5) (0.9) (0.5) (0.6) (0.5) (0.1)
Disposals of fixed assets and leasing assets 1.2 1.8 1.0 1.5 0.8 0.7 1.1 1.1
Customer-financing receivables, net – – 0.3 (0.3) 0.1 0.0 0.8 0.0
Operating cash flow 5.4 (0.9) 7.6 0.5 1.3 (1.4) 3.4 5.1
11999, excluding gain on sale of Volvo Cars of SEK 26.7 billion.
2Reported on a single line in 1992–1996.
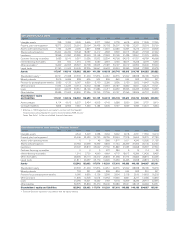
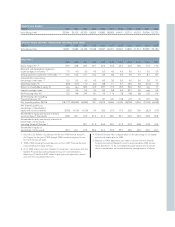
Consolidated cash-flow statements
SEKbn 1992 1993 1994 1995 1996 1997 1998 1999 2000 2001 2002
Operating income 1(2.9) (0.8) 16.9 13.3 13.2 12.8 11.8 7.5 6.7 (0.7) 2.8
Depreciation 3.1 3.8 5.1 5.6 5.4 6.8 9.6 5.2 6.3 10.0 10.8
Other items not affecting cash 2(3.5) (4.9) (0.3) (0.4) 0.5 2.0
Change in working capital 24.6 3.5 (8.9) (7.3) (11.2) 4.7 1.5 (1.0) (3.3) 6.4 1.0
Financial items and income tax 2(0.4) (2.0) (1.7) (1.3) (2.1) (1.3)
Cash flow from
operating activities 4.8 6.5 13.1 11.6 7.4 20.4 16.0 9.7 8.0 14.1 15.3
Investments in fixed assets (2.9) (3.5) (4.3) (6.5) (8.2) (9.9) (10.5) (4.9) (5.4) (8.1) (6.7)
Investments in leasing assets (1.3) (1.7) (2.5) (2.6) (3.9) (9.8) (12.7) (5.6) (5.7) (5.8) (5.2)
Disposals of fixed assets
and leasing assets 0.3 0.8 1.4 1.3 2.0 1.8 2.6 1.6 2.1 2.6 3.2
Customer financing receivables, net (3.7) 1.9 (1.5) (1.6) (4.8) (15.5) (12.8) (7.1) (4.5) (3.7) (5.7)
Shares and participations, net (0.2) 0.5 8.2 2.0 14.1 10.7 5.5 (25.9) (1.6) 3.9 (0.1)
Acquired and divested subsidiaries
and other business units, net 0.3 0.4 – (4.4) (0.9) (1.3) (5.6) 31.0 0.0 13.0 (0.2)
Cash flow after net investments (2.7) 4.9 14.4 (0.2) 5.7 (3.6) (17.5) (1.2) (7.1) 16.0 0.6
Increase (decrease) in loans 3.2 (5.9) (8.3) 1.5 6.8 5.6 19.5 16.3 8.1 6.2 (0.1)
Loans to external parties, net 0.5 (0.2) (0.9) (0.9) (1.9) (0.4) (0.3) (3.2) 0.3 0.2 1.7
Repurchase of own shares ––––––––(11.8) (8.3) –
Dividend to AB Volvo shareholders (1.2) (0.6) (0.6) (1.5) (1.9) (2.0) (2.2) (2.6) (3.1) (3.4) (3.4)
Other 0.4 0.2 (1.3) 0.7 (5.0) (5.9) (0.2) (0.1) 0.0 0.1 0.1
Change in liquid funds,
excluding translation differences 0.2 (1.6) 3.3 (0.4) 3.7 (6.3) (0.7) 9.2 (13.6) 10.8 (1.1)
Translation differences on liquid funds 1.8 1.3 (0.3) (0.7) (0.3) 0.3 0.3 (0.2) 0.3 0.6 (0.7)
Change in long-term securities holdings 0.9 ––––––––– –
Change in liquid funds 2.9 (0.3) 3.0 (1.1) 3.4 (6.0) (0.4) 9.0 (13.3) 11.4 (1.8)