Volvo 2002 Annual Report Download - page 43
Download and view the complete annual report
Please find page 43 of the 2002 Volvo annual report below. You can navigate through the pages in the report by either clicking on the pages listed below, or by using the keyword search tool below to find specific information within the annual report.-
 1
1 -
2
-
3
-
4
-
5
-
6
-
7
-
8
-
9
-
10
-
11
-
12
-
13
-
14
-
15
-
16
-
17
-
18
-
19
-
20
-
21
-
22
-
23
-
24
-
25
-
26
-
27
-
28
-
29
-
30
-
31
-
32
-
 33
33 -
 34
34 -
 35
35 -
 36
36 -
 37
37 -
 38
38 -
 39
39 -
 40
40 -
 41
41 -
 42
42 -
 43
43 -
 44
44 -
 45
45 -
 46
46 -
 47
47 -
 48
48 -
 49
49 -
 50
50 -
 51
51 -
 52
52 -
 53
53 -
54
-
55
-
56
-
57
-
58
-
59
-
60
-
61
-
62
-
63
-
64
-
65
-
66
-
67
-
68
-
69
-
70
-
71
-
72
-
73
-
74
-
75
-
76
-
77
-
78
-
79
-
80
-
81
-
82
-
83
-
84
-
85
-
86
-
87
-
88
-
89
-
90
-
91
-
92
-
93
-
94
-
95
-
96
 |
 |

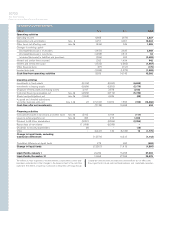
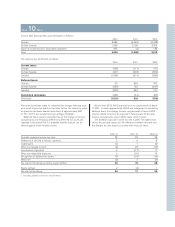
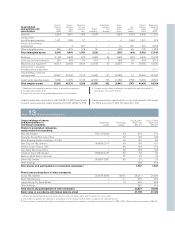
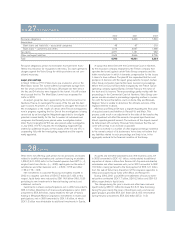
Note 10 Taxes
Income after financial items was distributed as follows:
2000 2001 2002
Sweden 3,983 (4,062) (2,448)
Outside Sweden 1,828 2,198 4,323
Share of income (loss) in associated companies 435 (2) 138
Total 6,246 (1,866) 2,013
Tax expense was distributed as follows:
2000 2001 2002
Current taxes:
Sweden (755) (111) (77)
Outside Sweden (291) (503) (569)
Subtotal (1,046) (614) (646)
Deferred taxes:
Sweden 23 820 762
Outside Sweden (243) 162 (641)
Subtotal (220) 982 121
Associated companies (244) (42) (65)
Total taxes (1,510) 326 (590)
Provisions have been made for estimated tax charges that may arise
as a result of prior tax audits in the Volvo Group. Tax claims for which
no provision has been deemed necessary of approximately 982
(1,151; 2,071) are included among contingent liabilities.
Deferred taxes relate to estimated tax on the change in tax-loss
carryforwards and temporary differences. Deferred tax assets are
reported to the extent that it is probable that the amount can be
utilized against future taxable income.
At year-end 2002, the Group had tax-loss carryforwards of about
17,300 , of which approximately 8,000 was recognized in calculating
deferred taxes. Accordingly, tax-loss carryforwards of about 9,300
may be utilized to reduce tax expense in future years. Of the total
tax-loss carryforwards, about 4,300 expire within 5 years.
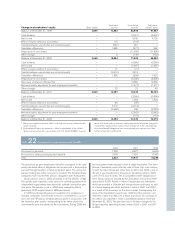
The Swedish corporate income tax rate is 28%. The table below
shows the principal reason for the difference between this rate and
the Group’s tax rate, based on income after financial items.
2000, % 2001, % 2002, %
Swedish corporate income tax rates 28 28 28
Difference in tax rate in various countries 2 6 8
Capital gains (2) 7 (2)
Other non-taxable income (2) 28 (16)
Amortization of goodwill 2 (17) 17
Other non-deductible expenses 2 (16) 15
Recognition of deferred tax assets 1(5) (19) (13)
Other, net (3) 2 (9)
Tax rate for the Group, excluding equity method 22 19 28
Equity method 2(2) 1
Tax rate for the Group 24 17 29
1 Including utilization of tax loss carryforwards.