Volvo 2002 Annual Report Download - page 88
Download and view the complete annual report
Please find page 88 of the 2002 Volvo annual report below. You can navigate through the pages in the report by either clicking on the pages listed below, or by using the keyword search tool below to find specific information within the annual report.-
 1
1 -
2
-
3
-
4
-
5
-
6
-
7
-
8
-
9
-
10
-
11
-
12
-
13
-
14
-
15
-
16
-
17
-
18
-
19
-
20
-
21
-
22
-
23
-
24
-
25
-
26
-
27
-
28
-
29
-
30
-
31
-
32
-
33
-
34
-
35
-
36
-
37
-
38
-
39
-
40
-
41
-
42
-
43
-
44
-
45
-
46
-
47
-
48
-
49
-
50
-
51
-
52
-
53
-
54
-
55
-
56
-
57
-
58
-
59
-
60
-
61
-
62
-
63
-
64
-
65
-
66
-
67
-
68
-
69
-
70
-
71
-
72
-
73
-
74
-
75
-
76
-
77
-
 78
78 -
 79
79 -
 80
80 -
 81
81 -
 82
82 -
 83
83 -
 84
84 -
 85
85 -
 86
86 -
 87
87 -
 88
88 -
 89
89 -
 90
90 -
 91
91 -
 92
92 -
 93
93 -
 94
94 -
 95
95 -
 96
96
 |
 |

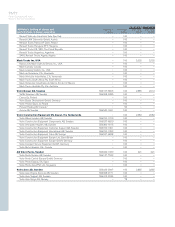
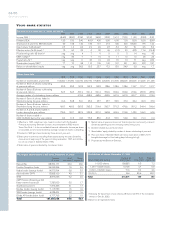
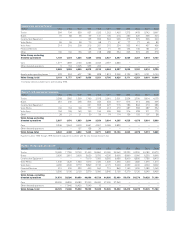
Return on operating capital, excluding restructuring costs
%1992 1993 1994 1995 1996 1997 1998 1999 2000 2001 2002
Trucks neg 8 >25 >25 10 18 >25 >25 9 4 5
Buses 5 18 22 18 12 17 8 4 6 neg neg
Construction Equipment – – – >25 23 23 18 19 16 9 4
Volvo Penta neg 11 19 17 neg 14 7 >25 >25 >25 >25
Volvo Aero 122 11 5 13 19 >25 23 19 25 20 1
1 As of 1997, return on operating capital for Aero excludes Volvo Aero Services.
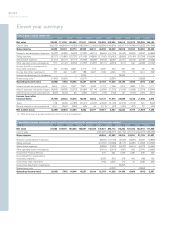
86/87
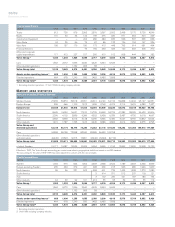
Eleven-year summary
1Operating income in 2001 included restructuring costs mainly related to the
integration of Mack and Renault of SEK 3,862 M of which 3,106 in Trucks,
392 in Buses and 364 in Construction Equipment.
2Effective January 1, 1999, Volvo Cars was reported as a divested operation.
The capital gain from the divestment was SEK 26,695 M.
3Restructuring costs in 1998 amounted to SEK 1,650 M of which 46 in
Trucks, 422 in Buses, 910 in Construction Equipment and 158 in Volvo
Penta. In addition operating income included a capital gain from the sale of
shares in Pharmacia UpJohn amounting to SEK 4,452 M.
4Operating income in 1997 included a capital gain from the sale of
shares in Pripps Ringnes amounting to SEK 3,027 M.
5Operating income in 1996 included a capital gain from the sale of
shares in Pharmacia UpJohn amounting to SEK 7,766 M.
6Operating income in 1995 included write-down of goodwill pertaining to
Volvo Construction Equipment, consolidated as from July 1, 1995, amounting
to SEK 1,817 M.
7Operating income in 1994 included a capital gain from the sale of
shares in Investment AB Cardo amounting to SEK 2,597 M and AB Custos
amounting to SEK 916 M.
8Operating income in 1993 included a provision of SEK 1,600 M relating to
excess value in Volvo Trucks, which was estimated to arise in connection
with exchange of shares with Renault.
9Refers to Volvo Trucks for 1992–2000.
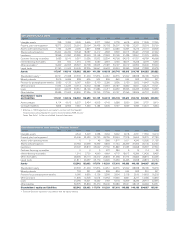
Operating income
SEKM 1992 1993 81994 71995 61996 51997 41998 31999 22000 200112002
Trucks 9(889) 585 4,051 5,020 783 1,707 2,769 3,247 1,414 (2,066) 1,189
Buses 71 313 318 405 331 550 (37) 224 440 (916) (94)
Construction Equipment — — — 717 1,162 1,436 626 1,709 1,594 527 406
Volvo Penta (184) 125 223 212 (27) 181 (63) 314 484 658 647
Volvo Aero 261 143 60 103 153 472 527 584 621 653 5
Financial Services 224 323 271 355 244 375 681 1,066 1,499 325 490
Other 581 (2,297) 7,533 1,422 9,377 3,624 3,950 319 616 143 194
Volvo Group excluding
divested operations 64 (808) 12,456 8,234 12,023 8,345 8,453 7,463 6,668 (676) 2,837
Cars (2,972) 23 2,599 490 1,080 4,409 3,375 26,695 — — —
Other divested operations — — 1,885 4,563 91 — — — — — —
Operating income (loss) Volvo Group (2,908) (785) 16,940 13,287 13,194 12,754 11,828 34,158 6,668 (676) 2,837
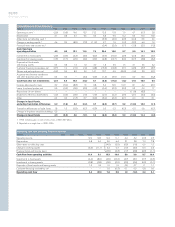
Operating margin
%1992 1993 1994 1995 1996 1997 1998 1999 2000 2001 2002
Trucks (3.7) 1.8 9.1 11.0 2.0 3.8 5.0 5.4 2.4 (1.8) 1.0
Buses 1.6 5.7 5.2 5.3 3.9 5.2 (0.3) 1.5 2.6 (5.5) (0.7)
Construction Equipment 1———10.4 9.1 8.6 3.2 9.1 8.0 2.5 1.9
Volvo Penta (7.2) 4.2 6.0 5.5 (0.7) 4.1 (1.3) 5.5 7.3 8.9 8.4
Volvo Aero 7.6 3.9 1.7 2.7 3.7 6.3 6.1 5.9 5.8 5.5 0.1
Volvo Group excluding
divested operations 0.1 (1.5) 18.1 11.4 17.1 9.6 7.9 6.4 5.5 (0.4) 1.6
Operating margin, total (3.6) (0.7) 11.0 8.0 8.8 7.1 5.7 29.3 5.5 (0.4) 1.6
1Included in the Volvo Group as of mid-year 1995. Operating margin for Volvo Construction Equipment for the years 1992 to 1995 amounted to (5.5), 5.2, 13.4 and
12.3.