Volvo 2002 Annual Report Download - page 87
Download and view the complete annual report
Please find page 87 of the 2002 Volvo annual report below. You can navigate through the pages in the report by either clicking on the pages listed below, or by using the keyword search tool below to find specific information within the annual report.-
 1
1 -
2
-
3
-
4
-
5
-
6
-
7
-
8
-
9
-
10
-
11
-
12
-
13
-
14
-
15
-
16
-
17
-
18
-
19
-
20
-
21
-
22
-
23
-
24
-
25
-
26
-
27
-
28
-
29
-
30
-
31
-
32
-
33
-
34
-
35
-
36
-
37
-
38
-
39
-
40
-
41
-
42
-
43
-
44
-
45
-
46
-
47
-
48
-
49
-
50
-
51
-
52
-
53
-
54
-
55
-
56
-
57
-
58
-
59
-
60
-
61
-
62
-
63
-
64
-
65
-
66
-
67
-
68
-
69
-
70
-
71
-
72
-
73
-
74
-
75
-
76
-
 77
77 -
 78
78 -
 79
79 -
 80
80 -
 81
81 -
 82
82 -
 83
83 -
 84
84 -
 85
85 -
 86
86 -
 87
87 -
 88
88 -
 89
89 -
 90
90 -
 91
91 -
 92
92 -
 93
93 -
 94
94 -
 95
95 -
 96
96
 |
 |
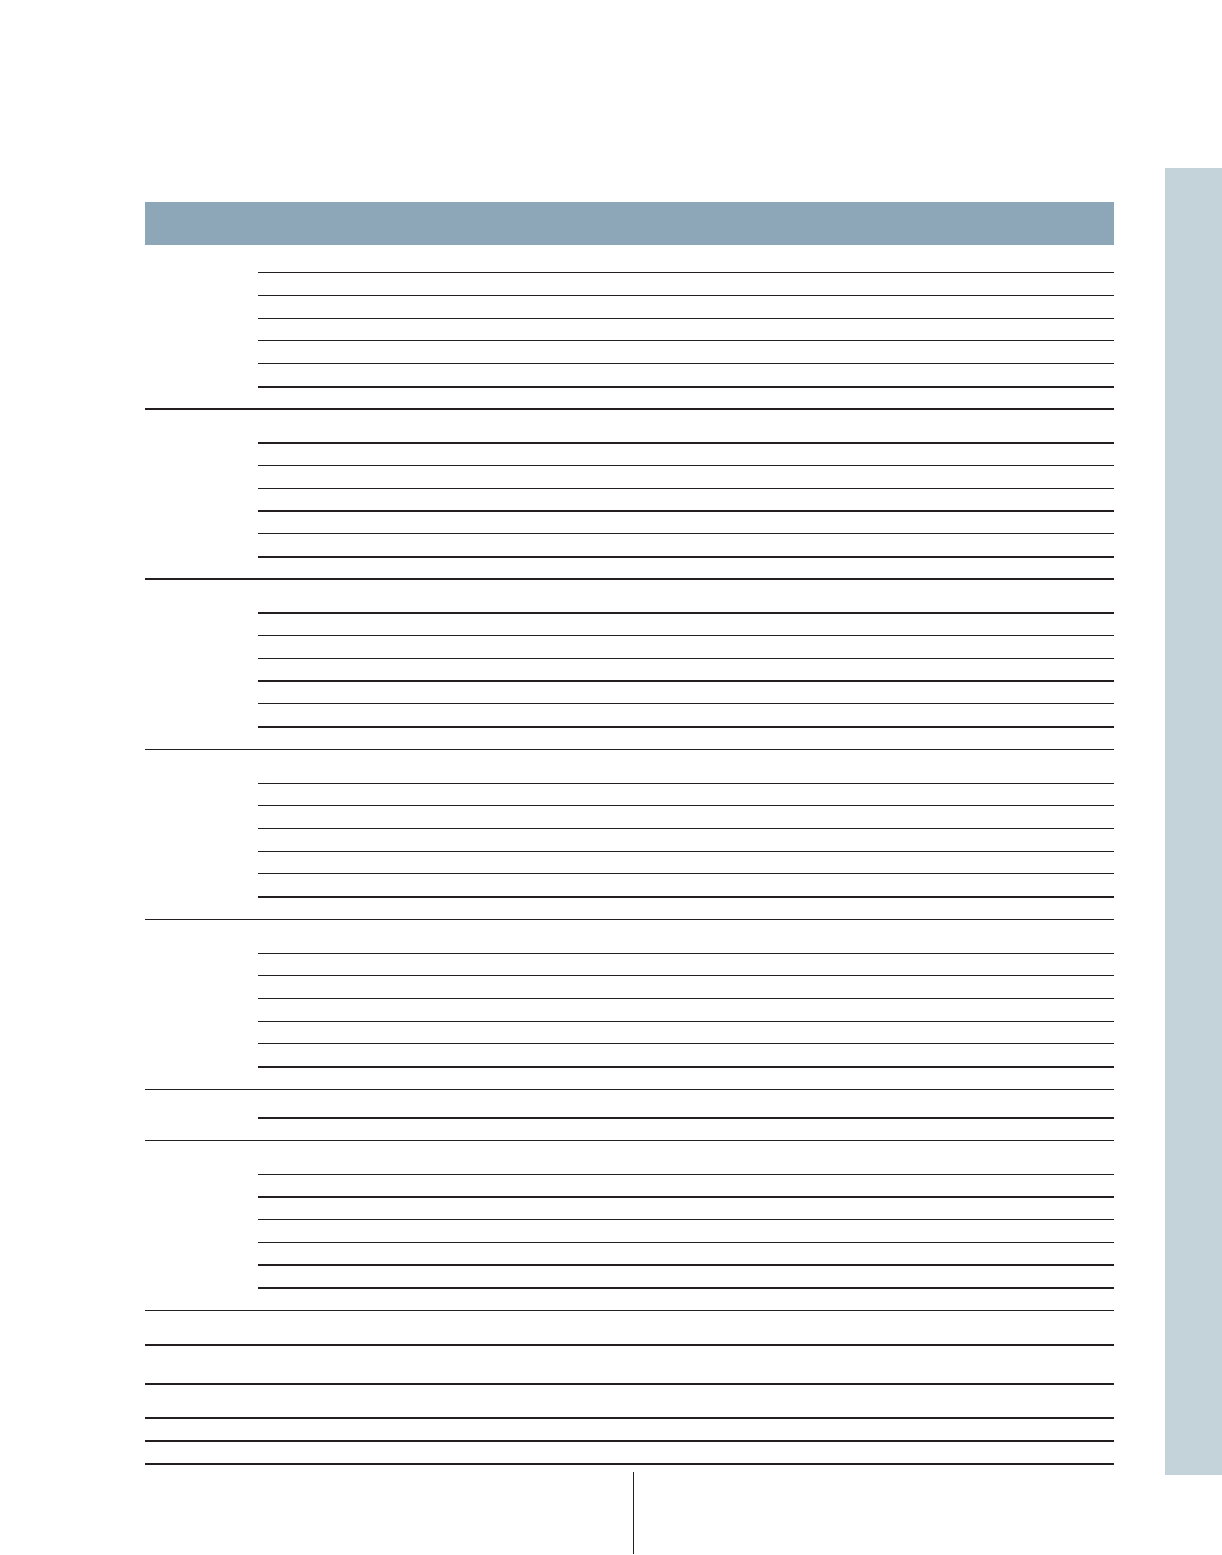
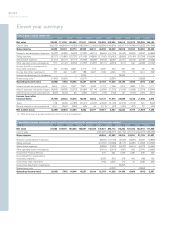
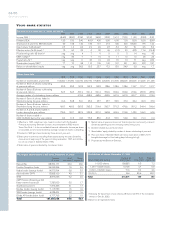
Net sales
SEKM 1992 1993 1994 1995 1996 1997 1998 1999 2000 2001 2002
Trucks 1Western Europe 13,520 14,025 21,121 22,548 21,244 22,280 27,837 30,006 30,415 60,841 61,406
Eastern Europe 518 599 948 1,299 1,721 2,274 3,089 2,265 3,158 5,526 6,424
North America 6,933 11,817 13,951 13,069 8,510 12,206 17,659 22,303 17,048 33,630 33,721
South America 484 3,188 4,780 4,641 2,759 3,832 3,777 2,190 3,111 3,993 3,277
Asia 1,675 2,170 2,474 2,863 2,577 2,410 2,047 2,010 3,432 4,659 5,919
Other markets 1,130 330 1,379 1,330 1,443 1,503 1,267 1,492 1,911 7,919 8,005
Total 24,260 32,129 44,653 45,750 38,254 44,505 55,676 60,266 59,075 116,568 118,752
Buses Western Europe 2,581 3,380 3,838 4,709 4,660 5,082 5,528 5,735 6,767 6,263 6,695
Eastern Europe 3 62 102 34 80 190 366 226 182 373 409
North America 1 43 34 736 1,575 2,314 5,574 6,871 7,723 6,847 3,838
South America 728 897 1,005 1,087 853 1,002 910 469 732 757 366
Asia 572 986 868 844 1,112 1,562 1,519 943 1,269 1,839 2,022
Other markets 566 119 289 285 247 432 389 469 514 596 705
Total 4,451 5,487 6,136 7,695 8,527 10,582 14,286 14,713 17,187 16,675 14,035
Construction Western Europe 4,199 7,163 7,836 9,557 9,901 10,029 10,326 10,383
Equipment 2Eastern Europe 112 93 263 336 193 255 341 454
North America 1,403 3,385 5,680 6,548 5,725 5,823 6,145 5,667
South America 556 598 991 957 498 776 847 709
Asia 339 937 1,036 1,092 1,903 2,484 2,773 3,048
Other markets 307 628 847 882 662 626 703 751
Total 6,916 12,804 16,653 19,372 18,882 19,993 21,135 21,012
Volvo Penta Western Europe 1,478 1,541 1,753 2,065 2,048 2,219 2,725 2,986 3,204 3,789 3,846
Eastern Europe 0 0 0 1 2 34 23 26 30 38 99
North America 483 859 1,326 1,139 1,142 1,332 1,412 1,770 2,257 2,175 2,261
South America 92 74 92 99 109 136 153 134 160 213 127
Asia 407 434 464 458 486 643 476 692 794 988 1,141
Other markets 82 78 107 116 98 102 142 153 154 177 195
Total 2,542 2,986 3,742 3,878 3,885 4,466 4,931 5,761 6,599 7,380 7,669
Volvo Aero Western Europe 2,146 2,281 2,400 2,590 2,950 3,682 4,231 4,560 4,651 4,788 3,422
Eastern Europe 0 0 13 27 8 6 47 16 42 87 28
North America 1,244 1,326 1,104 1,100 1,071 3,066 3,502 4,557 5,040 5,841 4,573
South America 13 4 0 4 4 257 284 193 134 187 177
Asia 6 5 66 66 89 264 336 491 701 708 497
Other markets 9 11 5 3 21 201 184 136 145 173 140
Total 3,418 3,627 3,588 3,790 4,143 7,476 8,584 9,953 10,713 11,784 8,837
Other and eliminations19,034 10,912 10,636 4,321 2,669 3,436 4,781 6,807 6,825 7,073 6,775
Net sales excl Financial Services 43,705 55,141 68,755 72,350 70,282 87,118 107,630 116,382 120,392 180,615 177,080
Financial Western Europe 1,144 1,177 1,198 4,758 5,384 4,461 5,465 6,300 6,240 5,314 5,573
Services Eastern Europe 0 0 86 185 257 360 424
North America 6 54 509 1,152 1,620 2,626 3,216 3,344
South America 153 72 297 455 452 451 403
Asia 0 0 0 1 0 24 49
Other markets 206 44 52 224 76 103 130 132
Total 1,144 1,177 1,198 4,970 5,635 5,094 7,224 8,637 9,678 9,495 9,925
Eliminations – – – – – – – – – (830) (807)
Volvo Group excluding
divested operations 44,849 56,318 69,953 77,320 75,917 92,212 114,854 125,019 130,070 189,280 186,198
Cars 44,598 58,158 73,598 83,340 83,589 96,453 103,798 – – – –
Other divested operations and eliminations (6,445) (3,321) 12,315 10,851 (3,446) (5,040) (5,716) – – – –
Volvo Group total 83,002 111,155 155,866 171,511 156,060 183,625 212,936 125,019 130,070 189,280 186,198
Effective in 1997, the Volvo Group’s accounting per market area reflects geo-
graphical definitions, based on an ISO standard. The figures for 1992–1996
have been adjusted to conform with the new principle.
1 Net sales 1992-2001 have been restated in accordance with new organiza-
tion effective from 2002.
2Subsidiary in the Volvo Group as of July 1995. Net sales for the Construction
Equipment business area in the years 1992 through 1995, calculated using
the average exchange rate for the US dollar in each year, amounted to
7,890, 9,665,12,084 and 13,684.
BUSINESS AREA STAT I ST I C S