Volvo 2002 Annual Report Download - page 10
Download and view the complete annual report
Please find page 10 of the 2002 Volvo annual report below. You can navigate through the pages in the report by either clicking on the pages listed below, or by using the keyword search tool below to find specific information within the annual report.-
 1
1 -
 2
2 -
 3
3 -
 4
4 -
 5
5 -
 6
6 -
 7
7 -
 8
8 -
 9
9 -
 10
10 -
 11
11 -
 12
12 -
 13
13 -
 14
14 -
 15
15 -
 16
16 -
 17
17 -
 18
18 -
 19
19 -
 20
20 -
 21
21 -
22
-
23
-
24
-
25
-
26
-
27
-
28
-
29
-
30
-
31
-
32
-
33
-
34
-
35
-
36
-
37
-
38
-
39
-
40
-
41
-
42
-
43
-
44
-
45
-
46
-
47
-
48
-
49
-
50
-
51
-
52
-
53
-
54
-
55
-
56
-
57
-
58
-
59
-
60
-
61
-
62
-
63
-
64
-
65
-
66
-
67
-
68
-
69
-
70
-
71
-
72
-
73
-
74
-
75
-
76
-
77
-
78
-
79
-
80
-
81
-
82
-
83
-
84
-
85
-
86
-
87
-
88
-
89
-
90
-
91
-
92
-
93
-
94
-
95
-
96
 |
 |

08/09
The Volvo Group year 2002
Cash-flow
statement
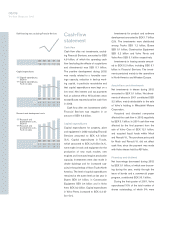
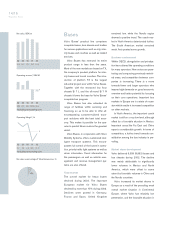
Cash flow
Cash flow after net investments, exclud-
ing Financial Services, amounted to SEK
4.9 billion, of which the operating cash
flow (excluding the effects of acquisitions
and divestments) was SEK 5.1 billion.
The positive development during 2002
was mostly related to a favorable earn-
ings capacity, reduction in tied-up work-
ing capital, in particular receivables and
that capital expenditures were kept on a
low level. Net interest and tax payments
had an adverse effect. All business areas
except Buses reported positive cash flow
in 2002.
Cash flow after net investments within
Financial Services was negative in an
amount of SEK 4.3 billion.
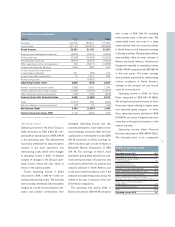
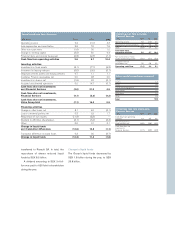
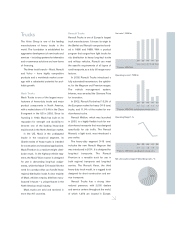
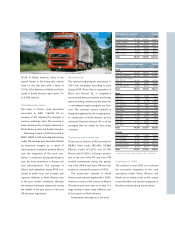
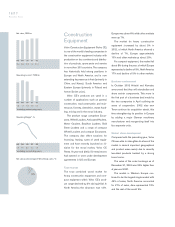
Capital expenditures
Capital expenditures for property, plant
and equipment in 2002 excluding Financial
Services amounted to SEK 4.5 billion
(5.1). Capital expenditures in Trucks,
which amounted to SEK 3.2 billion (4.1),
were made in tools and equipment for the
production of new truck models, new
engines and increased engine production
capacity. Investments were also made in
dealer buildings and for increased cap-
acity in the paintshop of Volvo Trucks North
America. The level of capital expenditures
remained at the same level as last year in
Buses SEK 0.1 billion, in Construction
Equipment SEK 0.4 billion and in Volvo
Aero SEK 0.2 billion. Capital expenditures
in Volvo Penta increased to SEK 0.2 bil-
lion (0.1).
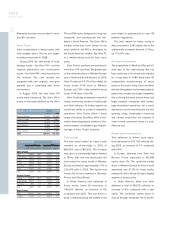
Investments for product and software
development amounted to SEK 1.7 billion
(2.0). The investments were distributed
among Trucks SEK 1.2 billion, Buses
SEK 0.1 billion, Construction Equipment
SEK 0.2 billion and Volvo Penta and
Volvo Aero SEK 0.1 billion respectively.
Investments in leasing assets amount-
ed to SEK 5.2 billion, including SEK 5.1
billion in Financial Services. The invest-
ments pertained mainly to the operations
in North America and Western Europe.
Acquisitions and divestments
Net investments in shares during 2002
amounted to SEK 0.1 billion. Net divest-
ments of shares in 2001 contributed SEK
3.2 billion, mainly attributable to the sale
of Volvo’s holding in Mitsubishi Motors
Corporation.
Acquired and divested companies
affected the cash flow in 2002 negatively
by SEK 0.1 billion. In 2001 cash flow was
affected by the final payment from the
sale of Volvo Cars of SEK 12.1 billion,
and acquired liquid funds within Mack
and Renault V.I.. The purchase price paid
for Mack and Renault V.I. did not affect
cash flow, since the payment was made
with Volvo shares held by AB Volvo.
Financing and dividend
Net borrowings decreased during 2002
by SEK 0.1 billion, of which new borrow-
ing during the year, mainly through the
issue of bonds and a commercial paper
program, contributed SEK 33.1 billion.
During the first quarter of 2001, Volvo
repurchased 10% of the total number of
shares outstanding, of which 5% were
98 99 00 01 02
4.9 5.2 5.4 8.3 6.8
Capital expenditures
Capital expenditures,
SEK bn
Capital expenditures,
% of net sales
4.3 4.1 4.2 4.4 3.7
98 99 00 01 02
4.3 4.5 4.9 5.4 5.9
Research and development costs
Research and
development costs,
SEK bn
Research and
development costs,
% of net sales
3.7 3.6 3.7 2.8 3.2
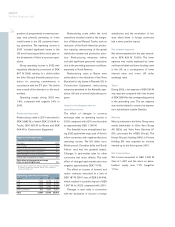
98 99 00 01 02
10 8 127 72 137 196
Self-financing ratio, excluding Financial Services