Virgin Media 2010 Annual Report Download - page 98
Download and view the complete annual report
Please find page 98 of the 2010 Virgin Media annual report below. You can navigate through the pages in the report by either clicking on the pages listed below, or by using the keyword search tool below to find specific information within the annual report.-
 1
1 -
2
-
3
-
4
-
5
-
6
-
7
-
8
-
9
-
10
-
11
-
12
-
13
-
14
-
15
-
16
-
17
-
18
-
19
-
20
-
21
-
22
-
23
-
24
-
25
-
26
-
27
-
28
-
29
-
30
-
31
-
32
-
33
-
34
-
35
-
36
-
37
-
38
-
39
-
40
-
41
-
42
-
43
-
44
-
45
-
46
-
47
-
48
-
49
-
50
-
51
-
52
-
53
-
54
-
55
-
56
-
57
-
58
-
59
-
60
-
61
-
62
-
63
-
64
-
65
-
66
-
67
-
68
-
69
-
70
-
71
-
72
-
73
-
74
-
75
-
76
-
77
-
78
-
79
-
80
-
81
-
82
-
83
-
84
-
85
-
86
-
87
-
 88
88 -
 89
89 -
 90
90 -
 91
91 -
 92
92 -
 93
93 -
 94
94 -
 95
95 -
 96
96 -
 97
97 -
 98
98 -
 99
99 -
 100
100 -
 101
101 -
 102
102 -
 103
103 -
 104
104 -
 105
105 -
 106
106 -
 107
107 -
 108
108 -
109
-
110
-
111
-
112
-
113
-
114
-
115
-
116
-
117
-
118
-
119
-
120
-
121
-
122
-
123
-
124
-
125
-
126
-
127
-
128
-
129
-
130
-
131
-
132
-
133
-
134
-
135
-
136
-
137
-
138
-
139
-
140
-
141
-
142
-
143
-
144
-
145
-
146
-
147
-
148
-
149
-
150
-
151
-
152
-
153
-
154
-
155
-
156
-
157
-
158
-
159
-
160
-
161
-
162
-
163
-
164
-
165
-
166
-
167
-
168
-
169
-
170
-
171
-
172
-
173
-
174
-
175
-
176
-
177
-
178
-
179
-
180
-
181
-
182
-
183
-
184
-
185
-
186
-
187
-
188
-
189
-
190
-
191
-
192
-
193
-
194
-
195
-
196
-
197
-
198
-
199
-
200
-
201
-
202
-
203
-
204
-
205
-
206
-
207
-
208
-
209
-
210
-
211
-
212
-
213
-
214
-
215
-
216
-
217
-
218
-
219
-
220
-
221
-
222
-
223
-
224
-
225
-
226
-
227
-
228
-
229
-
230
-
231
-
232
-
233
-
234
-
235
-
236
-
237
-
238
-
239
-
240
-
241
-
242
-
243
 |
 |

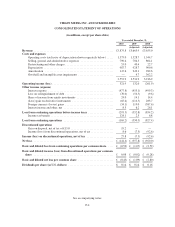
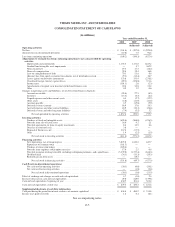
VIRGIN MEDIA INC. AND SUBSIDIARIES
CONSOLIDATED BALANCE SHEET
(in millions, except par value)
December 31, December 31,
2010 2009
(Adjusted)
Assets
Current assets
Cash and cash equivalents ........................................... £ 479.5 £ 430.5
Restricted cash .................................................... 2.2 6.0
Accounts receivable—trade, less allowances for doubtful accounts of £6.4
(2010) and £9.0 (2009) ........................................... 431.2 403.1
Inventory for resale ................................................ 26.4 12.9
Derivative financial instruments ...................................... 0.8 2.2
Prepaid expenses and other current assets ............................... 89.0 95.0
Current assets held for sale .......................................... — 152.8
Total current assets ............................................ 1,029.1 1,102.5
Fixed assets, net ....................................................... 4,763.1 5,045.8
Goodwill and other indefinite-lived assets .................................. 2,017.5 2,017.8
Intangible assets, net ................................................... 118.4 265.9
Equity investments ..................................................... 359.2 359.9
Derivative financial instruments .......................................... 394.6 235.1
Deferred financing costs, net of accumulated amortization of £23.8 (2010) and
£136.1 (2009) ....................................................... 98.6 112.2
Other assets .......................................................... 52.7 50.8
Total assets .......................................................... £8,833.2 £ 9,190.0
Liabilities and shareholders’ equity
Current liabilities
Accounts payable .................................................. £ 295.9 £ 312.5
Accrued expenses and other current liabilities ........................... 391.5 404.4
Derivative financial instruments ...................................... 13.3 17.8
Restructuring liabilities ............................................. 57.6 57.3
VAT and employee taxes payable ..................................... 88.6 67.0
Interest payable ................................................... 126.5 126.6
Deferred revenue .................................................. 301.7 282.8
Current portion of long term debt ..................................... 222.1 41.2
Current liabilities held for sale ........................................ — 83.8
Total current liabilities .......................................... 1,497.2 1,393.4
Long term debt, net of current portion ...................................... 5,798.3 5,933.5
Derivative financial instruments .......................................... 62.0 106.8
Deferred revenue and other long term liabilities .............................. 207.9 182.0
Deferred income taxes .................................................. 3.2 83.0
Total liabilities ........................................................ 7,568.6 7,698.7
Commitments and contingent liabilities
Shareholders’ equity
Common stock—$0.01 par value; authorized 1,000.0 (2010 and 2009) shares;
issued and outstanding 322.0 (2010) and 330.8 (2009) shares ............. 1.8 1.8
Additional paid-in capital ........................................... 4,375.2 4,483.2
Accumulated other comprehensive income .............................. 86.5 22.5
Accumulated deficit ................................................ (3,198.9) (3,016.2)
Total shareholders’ equity ....................................... 1,264.6 1,491.3
Total liabilities and shareholders’ equity ................................. £8,833.2 £ 9,190.0
See accompanying notes.
F-3