Virgin Media 2010 Annual Report Download - page 64
Download and view the complete annual report
Please find page 64 of the 2010 Virgin Media annual report below. You can navigate through the pages in the report by either clicking on the pages listed below, or by using the keyword search tool below to find specific information within the annual report.-
 1
1 -
2
-
3
-
4
-
5
-
6
-
7
-
8
-
9
-
10
-
11
-
12
-
13
-
14
-
15
-
16
-
17
-
18
-
19
-
20
-
21
-
22
-
23
-
24
-
25
-
26
-
27
-
28
-
29
-
30
-
31
-
32
-
33
-
34
-
35
-
36
-
37
-
38
-
39
-
40
-
41
-
42
-
43
-
44
-
45
-
46
-
47
-
48
-
49
-
50
-
51
-
52
-
53
-
 54
54 -
 55
55 -
 56
56 -
 57
57 -
 58
58 -
 59
59 -
 60
60 -
 61
61 -
 62
62 -
 63
63 -
 64
64 -
 65
65 -
 66
66 -
 67
67 -
 68
68 -
 69
69 -
 70
70 -
 71
71 -
 72
72 -
 73
73 -
 74
74 -
75
-
76
-
77
-
78
-
79
-
80
-
81
-
82
-
83
-
84
-
85
-
86
-
87
-
88
-
89
-
90
-
91
-
92
-
93
-
94
-
95
-
96
-
97
-
98
-
99
-
100
-
101
-
102
-
103
-
104
-
105
-
106
-
107
-
108
-
109
-
110
-
111
-
112
-
113
-
114
-
115
-
116
-
117
-
118
-
119
-
120
-
121
-
122
-
123
-
124
-
125
-
126
-
127
-
128
-
129
-
130
-
131
-
132
-
133
-
134
-
135
-
136
-
137
-
138
-
139
-
140
-
141
-
142
-
143
-
144
-
145
-
146
-
147
-
148
-
149
-
150
-
151
-
152
-
153
-
154
-
155
-
156
-
157
-
158
-
159
-
160
-
161
-
162
-
163
-
164
-
165
-
166
-
167
-
168
-
169
-
170
-
171
-
172
-
173
-
174
-
175
-
176
-
177
-
178
-
179
-
180
-
181
-
182
-
183
-
184
-
185
-
186
-
187
-
188
-
189
-
190
-
191
-
192
-
193
-
194
-
195
-
196
-
197
-
198
-
199
-
200
-
201
-
202
-
203
-
204
-
205
-
206
-
207
-
208
-
209
-
210
-
211
-
212
-
213
-
214
-
215
-
216
-
217
-
218
-
219
-
220
-
221
-
222
-
223
-
224
-
225
-
226
-
227
-
228
-
229
-
230
-
231
-
232
-
233
-
234
-
235
-
236
-
237
-
238
-
239
-
240
-
241
-
242
-
243
 |
 |

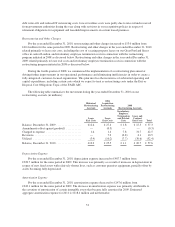
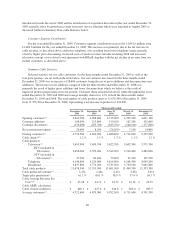
Summary Non-cable Statistics
Selected statistics for our residential customers that are not connected directly through our cable network, or
non-cable customers, for the three months ended December 31, 2010 as well as for the four prior quarters, are set
forth in the table below. Total non-cable products increased by 40,000 during the year ended December 31, 2010.
This increase in non-cable products is primarily due to the launch of wholesale line rental in August 2009, which
allows us to offer telephone line rental services bundled with our broadband services. This change has resulted in
the percentage of customers taking both telephone and broadband services increasing to 61.0% at December 31,
2010 from 51.7% at December 31, 2009.
Three months ended
December 31,
2010
September 30,
2010
June 30,
2010
March 31,
2010
December 31,
2009
Opening customers ....................... 274,000 272,600 270,600 267,200 255,200
Net customer additions .................... 2,700 1,400 2,000 3,400 12,000
Closing customers ........................ 276,700 274,000 272,600 270,600 267,200
Opening Non-cable products:
Telephone .......................... 161,200 154,400 147,600 139,800 124,900
Broadband .......................... 273,100 271,800 269,600 265,700 253,200
434,300 426,200 417,200 405,500 378,100
Net Non-cable product additions:
Telephone .......................... 8,400 6,800 6,800 7,800 14,900
Broadband .......................... 2,800 1,300 2,200 3,900 12,500
11,200 8,100 9,000 11,700 27,400
Closing Non-cable products:
Telephone .......................... 169,600 161,200 154,400 147,600 139,800
Broadband .......................... 275,900 273,100 271,800 269,600 265,700
445,500 434,300 426,200 417,200 405,500
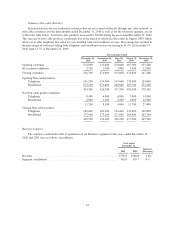
Business Segment
The summary combined results of operations of our Business segment for the years ended December 31,
2010 and 2009 were as follows (in millions):
Year ended
December 31,
2010 2009
Increase/
(Decrease)
Revenue .......................................................... £596.8 £580.8 2.8%
Segment contribution ............................................... 342.8 339.7 0.9
61