Virgin Media 2010 Annual Report Download - page 69
Download and view the complete annual report
Please find page 69 of the 2010 Virgin Media annual report below. You can navigate through the pages in the report by either clicking on the pages listed below, or by using the keyword search tool below to find specific information within the annual report.-
 1
1 -
2
-
3
-
4
-
5
-
6
-
7
-
8
-
9
-
10
-
11
-
12
-
13
-
14
-
15
-
16
-
17
-
18
-
19
-
20
-
21
-
22
-
23
-
24
-
25
-
26
-
27
-
28
-
29
-
30
-
31
-
32
-
33
-
34
-
35
-
36
-
37
-
38
-
39
-
40
-
41
-
42
-
43
-
44
-
45
-
46
-
47
-
48
-
49
-
50
-
51
-
52
-
53
-
54
-
55
-
56
-
57
-
58
-
 59
59 -
 60
60 -
 61
61 -
 62
62 -
 63
63 -
 64
64 -
 65
65 -
 66
66 -
 67
67 -
 68
68 -
 69
69 -
 70
70 -
 71
71 -
 72
72 -
 73
73 -
 74
74 -
 75
75 -
 76
76 -
 77
77 -
 78
78 -
 79
79 -
80
-
81
-
82
-
83
-
84
-
85
-
86
-
87
-
88
-
89
-
90
-
91
-
92
-
93
-
94
-
95
-
96
-
97
-
98
-
99
-
100
-
101
-
102
-
103
-
104
-
105
-
106
-
107
-
108
-
109
-
110
-
111
-
112
-
113
-
114
-
115
-
116
-
117
-
118
-
119
-
120
-
121
-
122
-
123
-
124
-
125
-
126
-
127
-
128
-
129
-
130
-
131
-
132
-
133
-
134
-
135
-
136
-
137
-
138
-
139
-
140
-
141
-
142
-
143
-
144
-
145
-
146
-
147
-
148
-
149
-
150
-
151
-
152
-
153
-
154
-
155
-
156
-
157
-
158
-
159
-
160
-
161
-
162
-
163
-
164
-
165
-
166
-
167
-
168
-
169
-
170
-
171
-
172
-
173
-
174
-
175
-
176
-
177
-
178
-
179
-
180
-
181
-
182
-
183
-
184
-
185
-
186
-
187
-
188
-
189
-
190
-
191
-
192
-
193
-
194
-
195
-
196
-
197
-
198
-
199
-
200
-
201
-
202
-
203
-
204
-
205
-
206
-
207
-
208
-
209
-
210
-
211
-
212
-
213
-
214
-
215
-
216
-
217
-
218
-
219
-
220
-
221
-
222
-
223
-
224
-
225
-
226
-
227
-
228
-
229
-
230
-
231
-
232
-
233
-
234
-
235
-
236
-
237
-
238
-
239
-
240
-
241
-
242
-
243
 |
 |

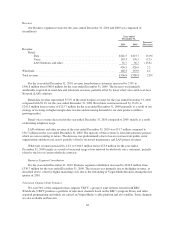
Share of Income From Equity Investments
For the year ended December 31, 2009, share of income from equity investments was £14.1 million as
compared with income of £14.4 million for the same period in 2008. The share of income from equity
investments in the years ended December 31, 2009 and 2008 was largely comprised of our proportionate share of
the income earned by UKTV, which was partially offset by our share of the losses incurred by Setanta Sports
News. Setanta Sports News ceased broadcasting on June 23, 2009 when Setanta Sports Limited entered
administration. See Segmental Results of Operations for the Years Ended December 31, 2009 and
2008—Television Channel Joint Ventures.
Gains (Losses) on Derivative Instruments
The losses on derivative instruments of £114.5 million in the year ended December 31, 2009, were mainly
driven by the U.S. dollar and euro weakening against the pound sterling in the first six months of the year, which
resulted in a reduction in the fair value of the U.S. dollar and euro denominated cross-currency interest rate
swaps not designated as hedges for accounting purposes. The gain on derivative instruments of £283.7 million in
the year ended December 31, 2008, mainly related to unrealized gains from the recognition of favorable mark to
market changes in U.S. dollar and euro denominated cross-currency interest rate swaps which are not designated
as accounting hedges but do economically mitigate the risk of certain exposures denominated in U.S. dollars and
euros.
Foreign Currency (Losses) Gains
For the year ended December 31, 2009, foreign currency gains were £119.0 million as compared with losses
of £387.6 million for the same period in 2008. The foreign currency gains in the year ended December 31, 2009
were primarily due to the strengthening of the pound sterling which occurred in the first six months of the year
relative to the U.S. dollar and euro and related foreign exchange gains on the principal portion of our U.S. dollar
convertible senior notes, which is unhedged, and the U.S. dollar and euro denominated tranches of the senior
credit facility. The foreign currency losses in the year ended December 31, 2008 were largely comprised of net
unrealized losses resulting from unfavorable exchange movements totaling £364.0 million on our U.S. dollar and
euro denominated debt, including a £171.1 million unfavorable exchange rate movement on the principal portion
of our U.S. dollar denominated convertible senior notes which is unhedged.
Interest Income and Other, Net
For the year ended December 31, 2009, interest income and other decreased to £6.2 million from
£26.1 million for the year ended December 31, 2008, primarily as a result of lower interest rates and lower cash
balances.
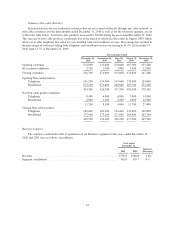
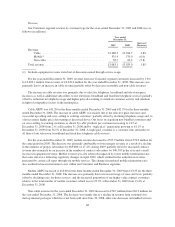
Income Tax Benefit
For the year ended December 31, 2009, income tax benefit was £2.5 million as compared with £6.8 million
for the same period in 2008. The 2009 and 2008 tax benefit was comprised of (in millions):
2009 2008
U.S. state and local income tax ................................................. £(0.1) £—
Foreign tax ................................................................. 4.9 4.7
Deferred U.S. income tax ..................................................... (3.8) (1.1)
Deferred foreign tax .......................................................... — 3.4
Alternative minimum tax ...................................................... 1.5 (0.2)
Total ...................................................................... £2.5 £6.8
66