Virgin Media 2010 Annual Report Download - page 50
Download and view the complete annual report
Please find page 50 of the 2010 Virgin Media annual report below. You can navigate through the pages in the report by either clicking on the pages listed below, or by using the keyword search tool below to find specific information within the annual report.-
 1
1 -
2
-
3
-
4
-
5
-
6
-
7
-
8
-
9
-
10
-
11
-
12
-
13
-
14
-
15
-
16
-
17
-
18
-
19
-
20
-
21
-
22
-
23
-
24
-
25
-
26
-
27
-
28
-
29
-
30
-
31
-
32
-
33
-
34
-
35
-
36
-
37
-
38
-
39
-
 40
40 -
 41
41 -
 42
42 -
 43
43 -
 44
44 -
 45
45 -
 46
46 -
 47
47 -
 48
48 -
 49
49 -
 50
50 -
 51
51 -
 52
52 -
 53
53 -
 54
54 -
 55
55 -
 56
56 -
 57
57 -
 58
58 -
 59
59 -
 60
60 -
61
-
62
-
63
-
64
-
65
-
66
-
67
-
68
-
69
-
70
-
71
-
72
-
73
-
74
-
75
-
76
-
77
-
78
-
79
-
80
-
81
-
82
-
83
-
84
-
85
-
86
-
87
-
88
-
89
-
90
-
91
-
92
-
93
-
94
-
95
-
96
-
97
-
98
-
99
-
100
-
101
-
102
-
103
-
104
-
105
-
106
-
107
-
108
-
109
-
110
-
111
-
112
-
113
-
114
-
115
-
116
-
117
-
118
-
119
-
120
-
121
-
122
-
123
-
124
-
125
-
126
-
127
-
128
-
129
-
130
-
131
-
132
-
133
-
134
-
135
-
136
-
137
-
138
-
139
-
140
-
141
-
142
-
143
-
144
-
145
-
146
-
147
-
148
-
149
-
150
-
151
-
152
-
153
-
154
-
155
-
156
-
157
-
158
-
159
-
160
-
161
-
162
-
163
-
164
-
165
-
166
-
167
-
168
-
169
-
170
-
171
-
172
-
173
-
174
-
175
-
176
-
177
-
178
-
179
-
180
-
181
-
182
-
183
-
184
-
185
-
186
-
187
-
188
-
189
-
190
-
191
-
192
-
193
-
194
-
195
-
196
-
197
-
198
-
199
-
200
-
201
-
202
-
203
-
204
-
205
-
206
-
207
-
208
-
209
-
210
-
211
-
212
-
213
-
214
-
215
-
216
-
217
-
218
-
219
-
220
-
221
-
222
-
223
-
224
-
225
-
226
-
227
-
228
-
229
-
230
-
231
-
232
-
233
-
234
-
235
-
236
-
237
-
238
-
239
-
240
-
241
-
242
-
243
 |
 |
Capital Expenditures. Our business requires substantial capital expenditures on a continuing basis for
various purposes, including expanding, maintaining and upgrading our network, investing in new customer
acquisitions, and offering new services. If we do not continue to invest in our network and in new technologies,
our ability to retain and acquire customers may be hindered. Therefore, our liquidity and the availability of cash
to fund capital projects are important drivers of our revenue. When our liquidity is restricted, so is our ability to
meet our capital expenditure requirements.
Consumer Segment
In our Consumer segment, cable customers account for the majority of our revenue. The number of
customers, the number and types of services that each customer uses and the prices we charge for these services
drive our revenue. Our profit is driven by the relative margins on the types and number of services we provide to
these customers and by the number of services that we provide to them and, with respect to our fixed and mobile
telephone customers, by usage levels of our services. For example, cable broadband internet is more profitable
than our television services and, on average, our “triple-play” customers are more profitable than “double-play”
or “single-play” customers. Similarly, over the service term, our contract mobile customers are more profitable
than our prepay mobile customers, and provide a better opportunity for cross-sell of our cable products. We
actively promote “quad-play” services, and our packaging of services and our pricing are designed to encourage
our customers to use multiple services such as television, fixed and mobile telephone and broadband at a lower
price than each stand-alone product on a combined basis. Factors particularly affecting our Consumer segment
include ARPU, churn, seasonality and distribution.
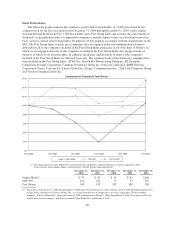
Cable ARPU. Cable ARPU is a measure we use to evaluate how effectively we are realizing potential
revenue from our residential cable customers on our network. We believe that our “triple-play” cable offering of
television, broadband and fixed line telephone services is attractive to our existing cable customer base and
generally allows us to increase our Cable ARPU by facilitating the sale of multiple services to each customer.
Cable ARPU excludes any revenue from our Mobile and non-cable customers.
Mobile ARPU. Mobile ARPU is a measure we use to evaluate how effectively we are realizing revenue
from our mobile customers. The mix of prepay and contract customers and level of usage have a material impact
on Mobile ARPU. The mix of our customer base is changing as we focus on acquiring higher lifetime value
contract customers, particularly through cross-selling mobile contracts to our cable customer base, rather than
lower lifetime value prepay customers. Consequently, the number of prepay customers is expected to continue to
decline in 2011, along with prepay usage.
Churn. Churn is a measure of the number of customers who stop subscribing to any of our services. An
increase in our churn can lead to increased costs and reduced revenue. We continue to focus on improving our
customer service and enhancing and expanding our service offerings to existing customers in order to manage
our churn rates. Our ability to reduce our churn rates beyond a base level is limited by factors like competition,
the economy and, in respect of our cable business, customers moving outside our network service area, in
particular during the summer season. Managing our churn rates is a significant component of our business plan.
Our churn rates may increase if our customer service is seen as unsatisfactory, if we are unable to deliver any of
our services without interruption, if we fail to match offerings by our competitors, if we increase our prices, if
there is an improvement in the U.K. housing market or if there is a prolonged economic downturn.
Seasonality. Some of our Consumer revenue streams are subject to seasonal factors. For example, telephone
usage revenue by residential customers tends to be slightly lower during summer holiday months. In the fourth
quarter of each year, our mobile customer acquisition and retention costs typically increase due to the Christmas
holiday period. Our Mobile ARPU generally decreases in the first quarter of each year due to the fewer number
of days in February and lower usage after the Christmas holiday period. Our churn rates include persons who
disconnect their service because of moves, resulting in a seasonal increase in our churn rates during the summer
months when higher levels of U.K. house moves occur and students leave their accommodation between
academic years.
47