Virgin Media 2010 Annual Report Download - page 61
Download and view the complete annual report
Please find page 61 of the 2010 Virgin Media annual report below. You can navigate through the pages in the report by either clicking on the pages listed below, or by using the keyword search tool below to find specific information within the annual report.-
 1
1 -
2
-
3
-
4
-
5
-
6
-
7
-
8
-
9
-
10
-
11
-
12
-
13
-
14
-
15
-
16
-
17
-
18
-
19
-
20
-
21
-
22
-
23
-
24
-
25
-
26
-
27
-
28
-
29
-
30
-
31
-
32
-
33
-
34
-
35
-
36
-
37
-
38
-
39
-
40
-
41
-
42
-
43
-
44
-
45
-
46
-
47
-
48
-
49
-
50
-
 51
51 -
 52
52 -
 53
53 -
 54
54 -
 55
55 -
 56
56 -
 57
57 -
 58
58 -
 59
59 -
 60
60 -
 61
61 -
 62
62 -
 63
63 -
 64
64 -
 65
65 -
 66
66 -
 67
67 -
 68
68 -
 69
69 -
 70
70 -
 71
71 -
72
-
73
-
74
-
75
-
76
-
77
-
78
-
79
-
80
-
81
-
82
-
83
-
84
-
85
-
86
-
87
-
88
-
89
-
90
-
91
-
92
-
93
-
94
-
95
-
96
-
97
-
98
-
99
-
100
-
101
-
102
-
103
-
104
-
105
-
106
-
107
-
108
-
109
-
110
-
111
-
112
-
113
-
114
-
115
-
116
-
117
-
118
-
119
-
120
-
121
-
122
-
123
-
124
-
125
-
126
-
127
-
128
-
129
-
130
-
131
-
132
-
133
-
134
-
135
-
136
-
137
-
138
-
139
-
140
-
141
-
142
-
143
-
144
-
145
-
146
-
147
-
148
-
149
-
150
-
151
-
152
-
153
-
154
-
155
-
156
-
157
-
158
-
159
-
160
-
161
-
162
-
163
-
164
-
165
-
166
-
167
-
168
-
169
-
170
-
171
-
172
-
173
-
174
-
175
-
176
-
177
-
178
-
179
-
180
-
181
-
182
-
183
-
184
-
185
-
186
-
187
-
188
-
189
-
190
-
191
-
192
-
193
-
194
-
195
-
196
-
197
-
198
-
199
-
200
-
201
-
202
-
203
-
204
-
205
-
206
-
207
-
208
-
209
-
210
-
211
-
212
-
213
-
214
-
215
-
216
-
217
-
218
-
219
-
220
-
221
-
222
-
223
-
224
-
225
-
226
-
227
-
228
-
229
-
230
-
231
-
232
-
233
-
234
-
235
-
236
-
237
-
238
-
239
-
240
-
241
-
242
-
243
 |
 |
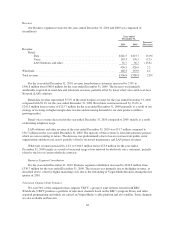
Mobile ARPU increased to £15.16 for the three months ended December 31, 2010 from £14.00 for the three
months ended December 31, 2009. The increase was primarily due to increased usage of voice and texts, driven
by the increased proportion of our higher value contract customers relative to the total number of mobile
customers. At December 31, 2010, contract customers comprised 39.5% of our mobile customer base compared
to 29.9% at December 31, 2009.
At December 31, 2010 we had 535,600 cable households with one or more mobile contracts, which is 20%
higher than a year ago. We also have a further 185,700 cable households with at least one prepay phone.
Collectively, this represents 15% of our cable base who take at least one mobile service from us. “Quad-play”
penetration, where a household takes all three cable products and a mobile phone service, increased to 11.8%,
compared to 10.6% a year ago. The ARPU of these “quad-play” customers is significantly higher than the
average cable ARPU.
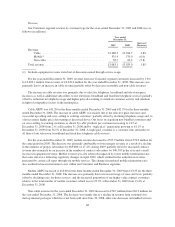
Non-cable revenue for the year ended December 31, 2010 increased to £77.2 million from £58.7 million for
the year ended December 31, 2009. The increased non-cable revenue was predominantly driven by the new
service offerings which were launched in August 2009 as discussed further in “Summary Non-cable Statistics”
below.
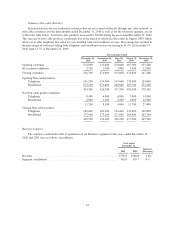
Consumer Segment Contribution
For the year ended December 31, 2010, Consumer segment contribution increased to £1,982.4 million from
£1,841.9 million for the year ended December 31, 2009. This increase was primarily due to the increase in
consumer revenues as described above.
58