Virgin Media 2010 Annual Report Download - page 91
Download and view the complete annual report
Please find page 91 of the 2010 Virgin Media annual report below. You can navigate through the pages in the report by either clicking on the pages listed below, or by using the keyword search tool below to find specific information within the annual report.-
 1
1 -
2
-
3
-
4
-
5
-
6
-
7
-
8
-
9
-
10
-
11
-
12
-
13
-
14
-
15
-
16
-
17
-
18
-
19
-
20
-
21
-
22
-
23
-
24
-
25
-
26
-
27
-
28
-
29
-
30
-
31
-
32
-
33
-
34
-
35
-
36
-
37
-
38
-
39
-
40
-
41
-
42
-
43
-
44
-
45
-
46
-
47
-
48
-
49
-
50
-
51
-
52
-
53
-
54
-
55
-
56
-
57
-
58
-
59
-
60
-
61
-
62
-
63
-
64
-
65
-
66
-
67
-
68
-
69
-
70
-
71
-
72
-
73
-
74
-
75
-
76
-
77
-
78
-
79
-
80
-
 81
81 -
 82
82 -
 83
83 -
 84
84 -
 85
85 -
 86
86 -
 87
87 -
 88
88 -
 89
89 -
 90
90 -
 91
91 -
 92
92 -
 93
93 -
 94
94 -
 95
95 -
 96
96 -
 97
97 -
 98
98 -
 99
99 -
 100
100 -
 101
101 -
102
-
103
-
104
-
105
-
106
-
107
-
108
-
109
-
110
-
111
-
112
-
113
-
114
-
115
-
116
-
117
-
118
-
119
-
120
-
121
-
122
-
123
-
124
-
125
-
126
-
127
-
128
-
129
-
130
-
131
-
132
-
133
-
134
-
135
-
136
-
137
-
138
-
139
-
140
-
141
-
142
-
143
-
144
-
145
-
146
-
147
-
148
-
149
-
150
-
151
-
152
-
153
-
154
-
155
-
156
-
157
-
158
-
159
-
160
-
161
-
162
-
163
-
164
-
165
-
166
-
167
-
168
-
169
-
170
-
171
-
172
-
173
-
174
-
175
-
176
-
177
-
178
-
179
-
180
-
181
-
182
-
183
-
184
-
185
-
186
-
187
-
188
-
189
-
190
-
191
-
192
-
193
-
194
-
195
-
196
-
197
-
198
-
199
-
200
-
201
-
202
-
203
-
204
-
205
-
206
-
207
-
208
-
209
-
210
-
211
-
212
-
213
-
214
-
215
-
216
-
217
-
218
-
219
-
220
-
221
-
222
-
223
-
224
-
225
-
226
-
227
-
228
-
229
-
230
-
231
-
232
-
233
-
234
-
235
-
236
-
237
-
238
-
239
-
240
-
241
-
242
-
243
 |
 |

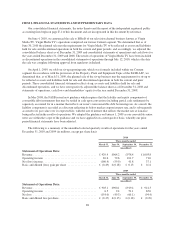
ITEM 8. FINANCIAL STATEMENTS AND SUPPLEMENTARY DATA
Our consolidated financial statements, the notes thereto and the report of the independent registered public
accounting firm begin on page F-1 of this document and are incorporated in this document by reference.
On June 4, 2010, we announced the sale to BSkyB of our television channel business known as Virgin
Media TV. Virgin Media TV’s operations comprised our former Content segment. We determined that as of
June 30, 2010 the planned sale met the requirements for Virgin Media TV to be reflected as assets and liabilities
held for sale and discontinued operations in both the current and prior periods, and accordingly, we adjusted the
consolidated balance sheet as of December 31, 2009 and consolidated statements of operations and cash flows for
the years ended December 31, 2009 and 2008. The results of operations of Virgin Media TV have been included
as discontinued operations in the consolidated statements of operations through July 12, 2010, which is the date
the sale was complete following approval from regulators in Ireland.
On April 1, 2009, we sold our sit-up reporting unit, which was formerly included within our Content
segment. In accordance with the provisions of the Property, Plant and Equipment Topic of the FASB ASC, we
determined that, as of March 31, 2009, the planned sale of the sit-up business met the requirements for sit-up to
be reflected as assets and liabilities held for sale and discontinued operations in both the current and prior
periods. These consolidated financial statements reflect sit-up, as assets and liabilities held for sale and
discontinued operations, and we have retrospectively adjusted the balance sheet as of December 31, 2008 and
statements of operations, cash flows and shareholders’ equity for the year ended December 31, 2008.
In May 2008, the FASB issued new guidance which requires that the liability and equity components of
convertible debt instruments that may be settled in cash upon conversion (including partial cash settlement) be
separately accounted for in a manner that reflects an issuer’s nonconvertible debt borrowing rate. As a result, the
liability component is recorded at a discount reflecting its below market coupon interest rate, and is subsequently
accreted to its par value over its expected life, with the rate of interest that reflects the market rate at issuance
being reflected in the results of operations. We adopted the guidance on January 1, 2009 as our convertible senior
notes are within the scope of the guidance and we have applied it on a retrospective basis, whereby our prior
period financial statements have been adjusted.
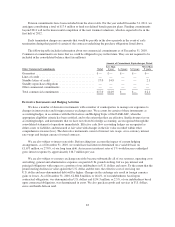
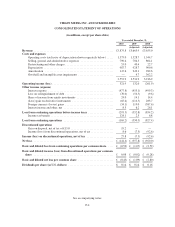
The following is a summary of the unaudited selected quarterly results of operations for the years ended
December 31, 2010 and 2009 (in millions, except per share data):
2010
Three months ended
March 31, June 30, September 30, December 31,
(unaudited)
Statement of Operations Data:
Revenue ............................................ £929.4 £964.2 £978.4 £1,003.8
Operating income .................................... 69.6 79.6 101.7 71.0
Net (loss) income ..................................... (160.4) (59.9) 41.8 37.1
Basic and diluted (loss) gain per share .................... £ (0.49) £ (0.18) £ 0.13 £ 0.11
2009
Three months ended
March 31, June 30, September 30, December 31,
(unaudited)
Statement of Operations Data:
Revenue ............................................ £903.1 £900.1 £919.4 £ 941.3
Operating income .................................... 6.5 9.4 51.1 65.0
Net loss ............................................ (154.0) (49.3) (60.1) (94.4)
Basic and diluted loss per share .......................... £ (0.47) £ (0.15) £ (0.18) £ (0.29)
88