Virgin Media 2010 Annual Report Download - page 66
Download and view the complete annual report
Please find page 66 of the 2010 Virgin Media annual report below. You can navigate through the pages in the report by either clicking on the pages listed below, or by using the keyword search tool below to find specific information within the annual report.-
 1
1 -
2
-
3
-
4
-
5
-
6
-
7
-
8
-
9
-
10
-
11
-
12
-
13
-
14
-
15
-
16
-
17
-
18
-
19
-
20
-
21
-
22
-
23
-
24
-
25
-
26
-
27
-
28
-
29
-
30
-
31
-
32
-
33
-
34
-
35
-
36
-
37
-
38
-
39
-
40
-
41
-
42
-
43
-
44
-
45
-
46
-
47
-
48
-
49
-
50
-
51
-
52
-
53
-
54
-
55
-
 56
56 -
 57
57 -
 58
58 -
 59
59 -
 60
60 -
 61
61 -
 62
62 -
 63
63 -
 64
64 -
 65
65 -
 66
66 -
 67
67 -
 68
68 -
 69
69 -
 70
70 -
 71
71 -
 72
72 -
 73
73 -
 74
74 -
 75
75 -
 76
76 -
77
-
78
-
79
-
80
-
81
-
82
-
83
-
84
-
85
-
86
-
87
-
88
-
89
-
90
-
91
-
92
-
93
-
94
-
95
-
96
-
97
-
98
-
99
-
100
-
101
-
102
-
103
-
104
-
105
-
106
-
107
-
108
-
109
-
110
-
111
-
112
-
113
-
114
-
115
-
116
-
117
-
118
-
119
-
120
-
121
-
122
-
123
-
124
-
125
-
126
-
127
-
128
-
129
-
130
-
131
-
132
-
133
-
134
-
135
-
136
-
137
-
138
-
139
-
140
-
141
-
142
-
143
-
144
-
145
-
146
-
147
-
148
-
149
-
150
-
151
-
152
-
153
-
154
-
155
-
156
-
157
-
158
-
159
-
160
-
161
-
162
-
163
-
164
-
165
-
166
-
167
-
168
-
169
-
170
-
171
-
172
-
173
-
174
-
175
-
176
-
177
-
178
-
179
-
180
-
181
-
182
-
183
-
184
-
185
-
186
-
187
-
188
-
189
-
190
-
191
-
192
-
193
-
194
-
195
-
196
-
197
-
198
-
199
-
200
-
201
-
202
-
203
-
204
-
205
-
206
-
207
-
208
-
209
-
210
-
211
-
212
-
213
-
214
-
215
-
216
-
217
-
218
-
219
-
220
-
221
-
222
-
223
-
224
-
225
-
226
-
227
-
228
-
229
-
230
-
231
-
232
-
233
-
234
-
235
-
236
-
237
-
238
-
239
-
240
-
241
-
242
-
243
 |
 |

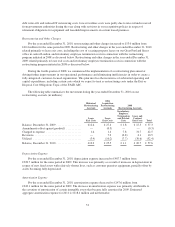
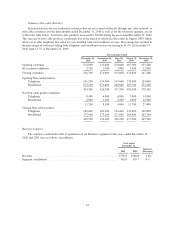
We account for our interest in UKTV under the equity method and recognized a share of net income of
£22.8 million and £16.5 million in the years ended December 31, 2010 and 2009, respectively. At December 31,
2010, our investment in UKTV was carried on the consolidated balance sheet at £359.2 million, which includes
outstanding loans totaling £120.4 million.
UKTV receives financing through loans from Virgin Media, which totaled £120.4 million at December 31,
2010. These loans effectively act as a revolving facility for UKTV. We received cash payments from UKTV in
the form of loan capital repayments of £8.7 million for the year ended December 31, 2010. We received
dividends, interest payments and payments for consortium tax relief from UKTV totaling £25.8 million during
2010.
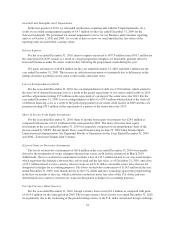
Additionally, we recorded a gain of £1.2 million for the year ended December 31, 2010 from the winding up
of our investment in our former joint venture, Setanta Sports News. Setanta Sports News ceased broadcasting in
June 2009 and has now been wound up. We recorded a loss of £2.4 million for the year ended December 31,
2009.
Consolidated Results of Operations for the Years Ended December 31, 2009 and 2008
Revenue
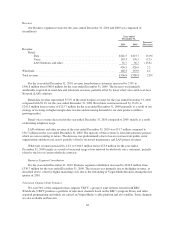
For the year ended December 31, 2009, revenue increased marginally to £3,663.9 million from
£3,655.0 million for the same period in 2008. This increase was primarily due to higher revenue in our Consumer
segment driven by increased cable revenue partially offset by decreases in mobile and non-cable revenues. The
increase was partially offset by lower Business segment revenue. See further discussion of our Consumer and
Business segments below.
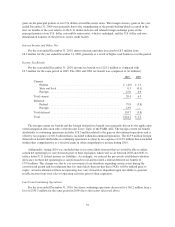
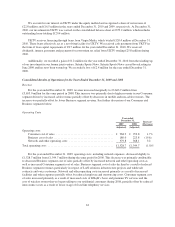
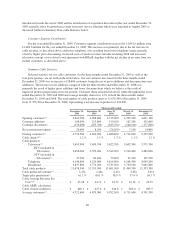
Operating Costs
Year ended
December 31, Increase/
(Decrease)2009 2008
(Adjusted) (Adjusted)
Operating costs:
Consumer cost of sales ........................................ £ 968.9 £ 952.8 1.7%
Business cost of sales .......................................... 180.0 223.8 (19.6)
Network and other operating costs ............................... 379.8 368.1 3.2
Total operating costs .............................................. £1,528.7 £1,544.7 (1.0)%
For the year ended December 31, 2009, operating costs, including network expenses, decreased slightly to
£1,528.7 million from £1,544.7 million during the same period in 2008. This decrease was primarily attributable
to decreased Business segment cost of sales partially offset by increased network and other operating costs as
well as increased Consumer segment cost of sales. Business segment cost of sales declined as a result of reduced
Business segment revenues particularly in respect of LAN solutions infrastructure projects and wholesale
contracts and voice customers. Network and other operating costs increased primarily as a result of increased
facilities and other expenses partially offset by reduced employee and outsourcing costs. Consumer segment cost
of sales increased primarily as a result of increased costs of BSkyB’s basic and premium TV services and the
cost of wireless routers that we began selling to our residential customers during 2008, partially offset by reduced
interconnect costs as a result of lower usage of fixed line telephony services.
63