Virgin Media 2010 Annual Report Download - page 141
Download and view the complete annual report
Please find page 141 of the 2010 Virgin Media annual report below. You can navigate through the pages in the report by either clicking on the pages listed below, or by using the keyword search tool below to find specific information within the annual report.-
 1
1 -
2
-
3
-
4
-
5
-
6
-
7
-
8
-
9
-
10
-
11
-
12
-
13
-
14
-
15
-
16
-
17
-
18
-
19
-
20
-
21
-
22
-
23
-
24
-
25
-
26
-
27
-
28
-
29
-
30
-
31
-
32
-
33
-
34
-
35
-
36
-
37
-
38
-
39
-
40
-
41
-
42
-
43
-
44
-
45
-
46
-
47
-
48
-
49
-
50
-
51
-
52
-
53
-
54
-
55
-
56
-
57
-
58
-
59
-
60
-
61
-
62
-
63
-
64
-
65
-
66
-
67
-
68
-
69
-
70
-
71
-
72
-
73
-
74
-
75
-
76
-
77
-
78
-
79
-
80
-
81
-
82
-
83
-
84
-
85
-
86
-
87
-
88
-
89
-
90
-
91
-
92
-
93
-
94
-
95
-
96
-
97
-
98
-
99
-
100
-
101
-
102
-
103
-
104
-
105
-
106
-
107
-
108
-
109
-
110
-
111
-
112
-
113
-
114
-
115
-
116
-
117
-
118
-
119
-
120
-
121
-
122
-
123
-
124
-
125
-
126
-
127
-
128
-
129
-
130
-
 131
131 -
 132
132 -
 133
133 -
 134
134 -
 135
135 -
 136
136 -
 137
137 -
 138
138 -
 139
139 -
 140
140 -
 141
141 -
 142
142 -
 143
143 -
 144
144 -
 145
145 -
 146
146 -
 147
147 -
 148
148 -
 149
149 -
 150
150 -
 151
151 -
152
-
153
-
154
-
155
-
156
-
157
-
158
-
159
-
160
-
161
-
162
-
163
-
164
-
165
-
166
-
167
-
168
-
169
-
170
-
171
-
172
-
173
-
174
-
175
-
176
-
177
-
178
-
179
-
180
-
181
-
182
-
183
-
184
-
185
-
186
-
187
-
188
-
189
-
190
-
191
-
192
-
193
-
194
-
195
-
196
-
197
-
198
-
199
-
200
-
201
-
202
-
203
-
204
-
205
-
206
-
207
-
208
-
209
-
210
-
211
-
212
-
213
-
214
-
215
-
216
-
217
-
218
-
219
-
220
-
221
-
222
-
223
-
224
-
225
-
226
-
227
-
228
-
229
-
230
-
231
-
232
-
233
-
234
-
235
-
236
-
237
-
238
-
239
-
240
-
241
-
242
-
243
 |
 |

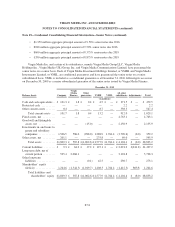
VIRGIN MEDIA INC. AND SUBSIDIARIES
NOTES TO CONSOLIDATED FINANCIAL STATEMENTS (continued)
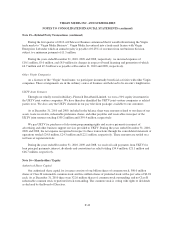
Note 14—Income Taxes (continued)
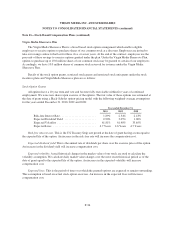
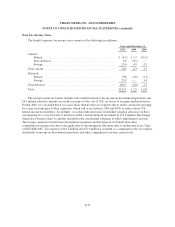
Deferred income taxes reflect the net tax effects of temporary differences between the carrying amounts of
assets and liabilities for financial reporting purposes and the amounts used for income tax purposes. Significant
components of deferred tax liabilities and assets are as follows (in millions):
December 31,
2010 2009
Deferred tax liabilities:
Intangibles ................................................ £ 31.5 £ 74.0
Equity investments .......................................... 83.0 83.0
Derivative instruments ....................................... 6.7 —
Convertible bond accretion .................................... 37.0 39.9
Unrealized foreign exchange differences ......................... 1.5 1.1
Total deferred tax liabilities ....................................... 159.7 198.0
Deferred tax assets:
Net operating losses ......................................... 829.9 1,029.2
Capital losses .............................................. 3,268.8 3,442.1
Depreciation and amortization ................................. 2,340.7 2,214.8
Accrued expenses ........................................... 57.8 56.9
Employee benefits .......................................... 19.8 26.6
Derivative instruments ....................................... — 11.0
Capital costs and others ...................................... 94.0 105.2
Total deferred tax assets .......................................... 6,611.0 6,885.8
Valuation allowance for deferred tax assets ........................... (6,454.5) (6,770.8)
Net deferred tax assets ........................................... 156.5 115.0
Net deferred tax liabilities ........................................ £ 3.2 £ 83.0
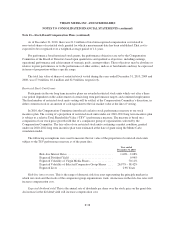
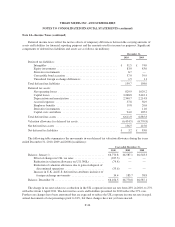
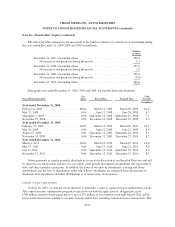
The following table summarizes the movements in our deferred tax valuation allowance during the years
ended December 31, 2010, 2009 and 2008 (in millions):
Year ended December 31,
2010 2009 2008
Balance, January 1 ...................................... £6,770.8 £6,587.1 £6,548.3
Effect of changes in U.K. tax rates ..................... (237.3) — —
Reduction in valuation allowance on U.S. NOLs .......... (79.8) — —
Reduction of valuation allowance due to gain on disposal of
discontinued operations ............................ (33.6) — —
Increase in U.K. and U.S. deferred tax attributes inclusive of
foreign exchange movements ....................... 34.4 183.7 38.8
Balance, December 31 ................................... £6,454.5 £6,770.8 £6,587.1
The change in tax rates relates to a reduction in the UK corporate income tax rate from 28% in 2010, to 27%
with effect from 1 April 2011. The deferred tax assets and liabilities presented for 2010 reflect the 27% rate.
Further rate changes have been announced that are expected to reduce the UK corporate income tax rate in equal
annual decrements of one percentage point to 24%, but these changes have not yet been enacted.
F-46