Virgin Media 2010 Annual Report Download - page 110
Download and view the complete annual report
Please find page 110 of the 2010 Virgin Media annual report below. You can navigate through the pages in the report by either clicking on the pages listed below, or by using the keyword search tool below to find specific information within the annual report.-
 1
1 -
2
-
3
-
4
-
5
-
6
-
7
-
8
-
9
-
10
-
11
-
12
-
13
-
14
-
15
-
16
-
17
-
18
-
19
-
20
-
21
-
22
-
23
-
24
-
25
-
26
-
27
-
28
-
29
-
30
-
31
-
32
-
33
-
34
-
35
-
36
-
37
-
38
-
39
-
40
-
41
-
42
-
43
-
44
-
45
-
46
-
47
-
48
-
49
-
50
-
51
-
52
-
53
-
54
-
55
-
56
-
57
-
58
-
59
-
60
-
61
-
62
-
63
-
64
-
65
-
66
-
67
-
68
-
69
-
70
-
71
-
72
-
73
-
74
-
75
-
76
-
77
-
78
-
79
-
80
-
81
-
82
-
83
-
84
-
85
-
86
-
87
-
88
-
89
-
90
-
91
-
92
-
93
-
94
-
95
-
96
-
97
-
98
-
99
-
 100
100 -
 101
101 -
 102
102 -
 103
103 -
 104
104 -
 105
105 -
 106
106 -
 107
107 -
 108
108 -
 109
109 -
 110
110 -
 111
111 -
 112
112 -
 113
113 -
 114
114 -
 115
115 -
 116
116 -
 117
117 -
 118
118 -
 119
119 -
 120
120 -
121
-
122
-
123
-
124
-
125
-
126
-
127
-
128
-
129
-
130
-
131
-
132
-
133
-
134
-
135
-
136
-
137
-
138
-
139
-
140
-
141
-
142
-
143
-
144
-
145
-
146
-
147
-
148
-
149
-
150
-
151
-
152
-
153
-
154
-
155
-
156
-
157
-
158
-
159
-
160
-
161
-
162
-
163
-
164
-
165
-
166
-
167
-
168
-
169
-
170
-
171
-
172
-
173
-
174
-
175
-
176
-
177
-
178
-
179
-
180
-
181
-
182
-
183
-
184
-
185
-
186
-
187
-
188
-
189
-
190
-
191
-
192
-
193
-
194
-
195
-
196
-
197
-
198
-
199
-
200
-
201
-
202
-
203
-
204
-
205
-
206
-
207
-
208
-
209
-
210
-
211
-
212
-
213
-
214
-
215
-
216
-
217
-
218
-
219
-
220
-
221
-
222
-
223
-
224
-
225
-
226
-
227
-
228
-
229
-
230
-
231
-
232
-
233
-
234
-
235
-
236
-
237
-
238
-
239
-
240
-
241
-
242
-
243
 |
 |

VIRGIN MEDIA INC. AND SUBSIDIARIES
NOTES TO CONSOLIDATED FINANCIAL STATEMENTS (continued)
Note 2—Significant Accounting Policies (continued)
Equity-linked Instruments
We determine the accounting treatment of equity-linked instruments according to the Distinguishing
Liabilities from Equity and Derivatives and Hedging Topics of the FASB ASC. This involves assessing whether
the instrument falls within the scope of the first topic and should be classified as an asset, liability or as equity. If
the guidance in the first topic is not applicable, we evaluate the instrument according to the second topic to
determine whether it is indexed to our stock and if necessary, whether it would be classified in equity. After
applying the above guidance, we concluded that the conversion hedges should be treated as an asset on the
consolidated balance sheet recognized at fair value and changes in the fair value are recognized as gains or losses
on derivative instruments in the consolidated statement of operations.
Leases
Our leasing activities are principally related to administrative facilities, network related facilities, retail
facilities and operating equipment. These leases generally provide us with renewal options. Certain leases contain
fluctuating or escalating payments and rent holiday periods. The related rent expense is recorded on a straight
line basis over the lease term.
Contingent rent is not a material component of our total rent expense.
Income Taxes
We provide for income taxes in accordance with the Income Taxes Topic of the FASB ASC. Judgment is
required in determining our provision for income taxes, deferred tax assets and liabilities and the extent to which
valuation allowances are necessary to reduce our deferred tax assets. We recognize valuation allowances if it is
not more likely than not that sufficient taxable income will be available in the future against which the temporary
differences and unused tax losses can be utilized. We have considered future taxable income and tax planning
strategies in assessing whether deferred tax assets should be recognized.
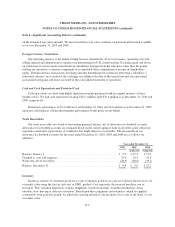
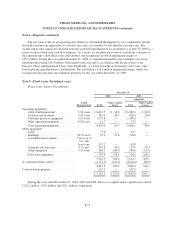
Income (Loss) from Continuing and Discontinued Operations Per Common Share and Net Loss Per Common
Share
Basic and diluted loss from continuing operations and discontinued operations per common share and net
loss per common share are computed by dividing the loss from continuing operations, discontinued operations
and net loss, respectively, by the average number of shares outstanding during the years ended December 31,
2010, 2009 and 2008. Options, warrants, shares issuable under the convertible senior notes, conversion hedges
and shares of restricted stock held in escrow are excluded from the calculation of diluted net loss from continuing
operations and discontinued operations per share for all periods presented since the inclusion of such securities is
anti-dilutive. The average number of shares outstanding is computed as follows (in millions):
Year ended December 31,
2010 2009 2008
Number of shares outstanding at start of period ...................... 329.4 328.1 327.5
Issues of common stock (average number outstanding during the period) . . 1.7 0.7 0.5
Purchase of treasury shares ...................................... (4.0) — —
Average number of shares outstanding ............................. 327.1 328.8 328.0
F-15