Virgin Media 2010 Annual Report Download - page 53
Download and view the complete annual report
Please find page 53 of the 2010 Virgin Media annual report below. You can navigate through the pages in the report by either clicking on the pages listed below, or by using the keyword search tool below to find specific information within the annual report.-
 1
1 -
2
-
3
-
4
-
5
-
6
-
7
-
8
-
9
-
10
-
11
-
12
-
13
-
14
-
15
-
16
-
17
-
18
-
19
-
20
-
21
-
22
-
23
-
24
-
25
-
26
-
27
-
28
-
29
-
30
-
31
-
32
-
33
-
34
-
35
-
36
-
37
-
38
-
39
-
40
-
41
-
42
-
 43
43 -
 44
44 -
 45
45 -
 46
46 -
 47
47 -
 48
48 -
 49
49 -
 50
50 -
 51
51 -
 52
52 -
 53
53 -
 54
54 -
 55
55 -
 56
56 -
 57
57 -
 58
58 -
 59
59 -
 60
60 -
 61
61 -
 62
62 -
 63
63 -
64
-
65
-
66
-
67
-
68
-
69
-
70
-
71
-
72
-
73
-
74
-
75
-
76
-
77
-
78
-
79
-
80
-
81
-
82
-
83
-
84
-
85
-
86
-
87
-
88
-
89
-
90
-
91
-
92
-
93
-
94
-
95
-
96
-
97
-
98
-
99
-
100
-
101
-
102
-
103
-
104
-
105
-
106
-
107
-
108
-
109
-
110
-
111
-
112
-
113
-
114
-
115
-
116
-
117
-
118
-
119
-
120
-
121
-
122
-
123
-
124
-
125
-
126
-
127
-
128
-
129
-
130
-
131
-
132
-
133
-
134
-
135
-
136
-
137
-
138
-
139
-
140
-
141
-
142
-
143
-
144
-
145
-
146
-
147
-
148
-
149
-
150
-
151
-
152
-
153
-
154
-
155
-
156
-
157
-
158
-
159
-
160
-
161
-
162
-
163
-
164
-
165
-
166
-
167
-
168
-
169
-
170
-
171
-
172
-
173
-
174
-
175
-
176
-
177
-
178
-
179
-
180
-
181
-
182
-
183
-
184
-
185
-
186
-
187
-
188
-
189
-
190
-
191
-
192
-
193
-
194
-
195
-
196
-
197
-
198
-
199
-
200
-
201
-
202
-
203
-
204
-
205
-
206
-
207
-
208
-
209
-
210
-
211
-
212
-
213
-
214
-
215
-
216
-
217
-
218
-
219
-
220
-
221
-
222
-
223
-
224
-
225
-
226
-
227
-
228
-
229
-
230
-
231
-
232
-
233
-
234
-
235
-
236
-
237
-
238
-
239
-
240
-
241
-
242
-
243
 |
 |

as projected labor costs. Considerable management judgment is necessary to estimate discounted future cash
flows and those estimates include inherent uncertainties, including those relating to the timing and amount of
future cash flows and the discount rate used in the calculation. Assumptions used in these cash flow projections
are consistent with our internal forecasts. If actual results differ from the assumptions used in the impairment
review, we may incur additional impairment charges in the future. Assumptions made about levels of
competition and rates of growth (or decline) in the economy on a longer term basis could impact the valuation to
be used in future annual impairment testing.
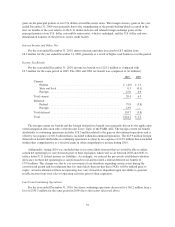
The table below presents the goodwill and indefinite-lived intangible assets allocated to our Consumer and
Business reporting units, and the significant inputs utilized in developing our estimate of fair value for the annual
impairment tests performed in 2010 for each of these reporting units.
Consumer Business
Goodwill and indefinite-lived intangibles as at December 31, 2010 .... £1,811.6 million £205.9 million
Market multiples inputs:
Number of comparable companies .......................... Nine Seven
EBITDA multiples of comparable companies .................. 4.5to8.0times 3.0 to 8.9 times
Revenue multiples of comparable companies .................. 1.57 to 4.07 times 0.51 to 3.00 times
Comparable transactions inputs:
Number of transactions ................................... Sixteen Nine
EBITDA multiples of comparable transactions ................ 3.5to11.0 times 3.7 to 11.7 times
Revenue multiples of comparable transactions ................. 0.44 to 4.31 times 0.59 to 2.74 times
Discounted cash flow approach:
Discount rate applied ..................................... 8% 10%
Goodwill relating to our Consumer and Business reporting units was not at risk of failing step one of the
goodwill impairment analysis as of our October 1, 2010 evaluation.
Fixed Assets
Labor and overhead costs directly related to the construction and installation of fixed assets, including
payroll and related costs of some employees and related rent and other occupancy costs, are capitalized. The
payroll and related costs of some employees that are directly related to construction and installation activities are
capitalized based on specific time devoted to these activities where identifiable. In cases where the time devoted
to these activities is not specifically identifiable, we capitalize costs based upon estimated allocations. Costs
associated with initial customer installations are capitalized. The costs of reconnecting the same service to a
previously installed premise are charged to expense in the period incurred. Costs for repairs and maintenance are
charged to expense as incurred.
We assign fixed assets and intangible assets useful lives that impact the annual depreciation and
amortization expense. The assignment of useful lives involves significant judgments and the use of estimates.
Our management use their experience and expertise in applying judgments about appropriate estimates. Changes
in technology or changes in intended use of these assets may cause the estimated useful life to change, resulting
in higher or lower depreciation charges or asset impairment charges.
Long-lived assets and certain identifiable intangibles (intangible assets that do not have indefinite lives) to
be held and used by an entity are reviewed for impairment whenever events or changes in circumstances indicate
that the carrying amount of an asset may not be recoverable in accordance with the Property, Plant and
Equipment Topic of the FASB ASC. Indications of impairment are determined by reviewing undiscounted
projected future cash flows. If impairment is indicated, the amount of the impairment is the amount by which the
carrying value exceeds the fair value of the assets.
50