Virgin Media 2010 Annual Report Download - page 72
Download and view the complete annual report
Please find page 72 of the 2010 Virgin Media annual report below. You can navigate through the pages in the report by either clicking on the pages listed below, or by using the keyword search tool below to find specific information within the annual report.-
 1
1 -
2
-
3
-
4
-
5
-
6
-
7
-
8
-
9
-
10
-
11
-
12
-
13
-
14
-
15
-
16
-
17
-
18
-
19
-
20
-
21
-
22
-
23
-
24
-
25
-
26
-
27
-
28
-
29
-
30
-
31
-
32
-
33
-
34
-
35
-
36
-
37
-
38
-
39
-
40
-
41
-
42
-
43
-
44
-
45
-
46
-
47
-
48
-
49
-
50
-
51
-
52
-
53
-
54
-
55
-
56
-
57
-
58
-
59
-
60
-
61
-
 62
62 -
 63
63 -
 64
64 -
 65
65 -
 66
66 -
 67
67 -
 68
68 -
 69
69 -
 70
70 -
 71
71 -
 72
72 -
 73
73 -
 74
74 -
 75
75 -
 76
76 -
 77
77 -
 78
78 -
 79
79 -
 80
80 -
 81
81 -
 82
82 -
83
-
84
-
85
-
86
-
87
-
88
-
89
-
90
-
91
-
92
-
93
-
94
-
95
-
96
-
97
-
98
-
99
-
100
-
101
-
102
-
103
-
104
-
105
-
106
-
107
-
108
-
109
-
110
-
111
-
112
-
113
-
114
-
115
-
116
-
117
-
118
-
119
-
120
-
121
-
122
-
123
-
124
-
125
-
126
-
127
-
128
-
129
-
130
-
131
-
132
-
133
-
134
-
135
-
136
-
137
-
138
-
139
-
140
-
141
-
142
-
143
-
144
-
145
-
146
-
147
-
148
-
149
-
150
-
151
-
152
-
153
-
154
-
155
-
156
-
157
-
158
-
159
-
160
-
161
-
162
-
163
-
164
-
165
-
166
-
167
-
168
-
169
-
170
-
171
-
172
-
173
-
174
-
175
-
176
-
177
-
178
-
179
-
180
-
181
-
182
-
183
-
184
-
185
-
186
-
187
-
188
-
189
-
190
-
191
-
192
-
193
-
194
-
195
-
196
-
197
-
198
-
199
-
200
-
201
-
202
-
203
-
204
-
205
-
206
-
207
-
208
-
209
-
210
-
211
-
212
-
213
-
214
-
215
-
216
-
217
-
218
-
219
-
220
-
221
-
222
-
223
-
224
-
225
-
226
-
227
-
228
-
229
-
230
-
231
-
232
-
233
-
234
-
235
-
236
-
237
-
238
-
239
-
240
-
241
-
242
-
243
 |
 |

introduced towards the end of 2008 and the introduction of acquisition discounts in the year ended December 31,
2009, partially offset by growth in revenue from new service offerings which were launched in August 2009 as
discussed further in Summary Non-cable Statistics below.
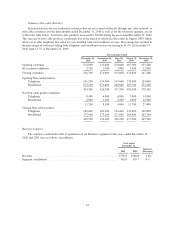
Consumer Segment Contribution
For the year ended December 31, 2009, Consumer segment contribution increased to £1,841.9 million from
£1,803.6 million for the year ended December 31, 2008. This increase was primarily due to the net increase in
cable revenue, as described above, and lower telephony costs resulting from lower telephony usage, partially
offset by higher price discounting, increased costs of wireless routers introduced during 2008 and increased
television carriage costs related to our agreement with BSkyB, together with the net decline in revenue from our
mobile customers, as described above.
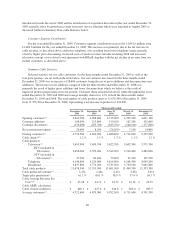
Summary Cable Statistics
Selected statistics for our cable customers, for the three months ended December 31, 2009 as well as the
four prior quarters, are set forth in the table below. Our net customer movement for the three months ended
December 31, 2009 was an increase of 28,600 customers being the net of gross additions and disconnections (net
additions). The increase in net additions compared with the three months ended December 31, 2008 was
primarily the result of higher gross additions and fewer disconnections which we believe is the result of
improved product propositions in recent periods. Customer churn remained relatively stable throughout the years
ended December 31, 2009 and 2008 and average monthly churn was 1.2% in both the three months ended
December 31, 2009 and 2008. The total number of cable products grew to 11,678,300 at December 31, 2009
from 11,353,300 at December 31, 2008, representing a net increase in products of 324,600.
Three months ended
December 31,
2009
September 30,
2009
June 30,
2009
March 31,
2009
December 31,
2008
Opening customers(1) .............. 4,694,900 4,686,800 4,713,000 4,705,900 4,691,100
Customer additions ............... 198,600 213,800 159,500 167,200 192,600
Customer disconnects ............. (170,000) (205,700) (185,700) (160,100) (177,800)
Net customer movement ........... 28,600 8,100 (26,200) 7,100 14,800
Closing customers(1) .............. 4,723,500 4,694,900 4,686,800 4,713,000 4,705,900
Cable churn(1)(2) .................. 1.2% 1.5% 1.3% 1.1% 1.2%
Cable products:
Television(1) ................. 3,693,900 3,659,700 3,622,700 3,602,300 3,571,700
DTV (included in
Television) ............ 3,656,200 3,599,300 3,543,300 3,510,400 3,469,000
ATV (included in
Television)(1) .......... 37,700 60,400 79,400 91,900 102,700
Telephone .................. 4,146,600 4,120,000 4,104,000 4,108,300 4,099,200
Broadband .................. 3,837,800 3,774,200 3,735,200 3,730,100 3,682,800
Total cable products .............. 11,678,300 11,553,900 11,461,900 11,440,700 11,353,700
Cable products/Customer(1) ......... 2.47x 2.46x 2.45x 2.43x 2.41x
Triple-play penetration(1) ........... 61.1 % 60.1 % 58.9 % 57.6 % 56.5 %
Cable Average Revenue Per
User(1)(3) ...................... £ 45.28 £ 44.71 £ 43.72 £ 42.74 £ 42.79
Cable ARPU calculation:
Cable revenue (millions) ........... £ 640.1 £ 627.6 £ 616.8 £ 604.0 £ 603.5
Average customers(1) .............. 4,712,600 4,679,000 4,702,300 4,711,600 4,701,700
69