Virgin Media 2010 Annual Report Download - page 125
Download and view the complete annual report
Please find page 125 of the 2010 Virgin Media annual report below. You can navigate through the pages in the report by either clicking on the pages listed below, or by using the keyword search tool below to find specific information within the annual report.-
 1
1 -
2
-
3
-
4
-
5
-
6
-
7
-
8
-
9
-
10
-
11
-
12
-
13
-
14
-
15
-
16
-
17
-
18
-
19
-
20
-
21
-
22
-
23
-
24
-
25
-
26
-
27
-
28
-
29
-
30
-
31
-
32
-
33
-
34
-
35
-
36
-
37
-
38
-
39
-
40
-
41
-
42
-
43
-
44
-
45
-
46
-
47
-
48
-
49
-
50
-
51
-
52
-
53
-
54
-
55
-
56
-
57
-
58
-
59
-
60
-
61
-
62
-
63
-
64
-
65
-
66
-
67
-
68
-
69
-
70
-
71
-
72
-
73
-
74
-
75
-
76
-
77
-
78
-
79
-
80
-
81
-
82
-
83
-
84
-
85
-
86
-
87
-
88
-
89
-
90
-
91
-
92
-
93
-
94
-
95
-
96
-
97
-
98
-
99
-
100
-
101
-
102
-
103
-
104
-
105
-
106
-
107
-
108
-
109
-
110
-
111
-
112
-
113
-
114
-
 115
115 -
 116
116 -
 117
117 -
 118
118 -
 119
119 -
 120
120 -
 121
121 -
 122
122 -
 123
123 -
 124
124 -
 125
125 -
 126
126 -
 127
127 -
 128
128 -
 129
129 -
 130
130 -
 131
131 -
 132
132 -
 133
133 -
 134
134 -
 135
135 -
136
-
137
-
138
-
139
-
140
-
141
-
142
-
143
-
144
-
145
-
146
-
147
-
148
-
149
-
150
-
151
-
152
-
153
-
154
-
155
-
156
-
157
-
158
-
159
-
160
-
161
-
162
-
163
-
164
-
165
-
166
-
167
-
168
-
169
-
170
-
171
-
172
-
173
-
174
-
175
-
176
-
177
-
178
-
179
-
180
-
181
-
182
-
183
-
184
-
185
-
186
-
187
-
188
-
189
-
190
-
191
-
192
-
193
-
194
-
195
-
196
-
197
-
198
-
199
-
200
-
201
-
202
-
203
-
204
-
205
-
206
-
207
-
208
-
209
-
210
-
211
-
212
-
213
-
214
-
215
-
216
-
217
-
218
-
219
-
220
-
221
-
222
-
223
-
224
-
225
-
226
-
227
-
228
-
229
-
230
-
231
-
232
-
233
-
234
-
235
-
236
-
237
-
238
-
239
-
240
-
241
-
242
-
243
 |
 |

VIRGIN MEDIA INC. AND SUBSIDIARIES
NOTES TO CONSOLIDATED FINANCIAL STATEMENTS (continued)
Note 9—Fair Value Measurements (continued)
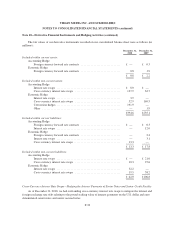
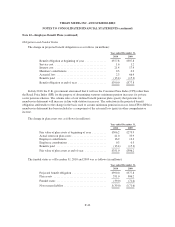
The carrying amounts and fair values of our long term debt are as follows (in millions):
December 31, 2010 December 31, 2009
Carrying
Amount
Fair
Value
Carrying
Amount
Fair
Value
Senior credit facility ...................................... £1,675.0 £1,672.5 £3,112.8 £3,043.5
8.75% U.S. dollar senior notes due 2014 ...................... — — 55.3 57.7
9.75% sterling senior notes due 2014 ......................... — — 78.8 81.6
8.75% euro senior notes due 2014 ........................... — — 41.9 43.7
9.125% U.S. dollar senior notes due 2016 ..................... 352.6 380.3 340.2 359.4
6.50% U.S. dollar convertible senior notes due 2016 ............. 535.4 1,050.8 504.5 737.0
9.50% U.S. dollar senior notes due 2016 ...................... 843.2 990.5 810.9 895.8
9.50% euro senior notes due 2016 ........................... 148.5 182.1 152.9 173.5
8.375% U.S. dollar senior notes due 2019 ..................... 378.8 421.5 365.1 377.0
8.875% sterling senior notes due 2019 ........................ 344.8 397.7 344.5 355.3
6.50% U.S. dollar senior secured notes due 2018 ................ 632.3 677.5 — —
7.00% sterling senior secured notes due 2018 .................. 863.1 925.3 — —
Concentrations of Credit Risk
Our financial instruments that are exposed to concentrations of credit risk consist primarily of cash, trade
receivables and derivative contracts.
At December 31, 2010 and 2009, we had £479.5 million and £430.5 million, respectively, in cash and cash
equivalents. These cash and cash equivalents are on deposit with major financial institutions and, as part of our
cash management process, we perform regular evaluations of the credit standing of these institutions using a
range of metrics. We have not experienced any losses in cash balances and do not believe we are exposed to any
significant credit risk on our cash balances.
Concentrations of credit risk with respect to trade receivables are limited because of the large number of
customers and their dispersion across geographic areas. We perform periodic credit evaluations of our Business
segment customers’ financial condition and generally do not require collateral. No single group or customer
represents greater than 10% of total accounts receivable.
Concentrations of credit risk with respect to derivative contracts are focused within a limited number of
international financial institutions with which we operate and relate only to derivatives with recorded asset
balances at December 31, 2010. We perform regular reviews of the financial institutions with which we operate
as to their credit worthiness and financial condition. We have not experienced non-performance by any of our
derivative counterparties nor do we expect there to be non-performance risks associated with our counterparties.
At December 31, 2010, based on market values, we had 49% of our derivative contracts with three financial
institutions, each with more than 10% of our total exposure. At December 31, 2009, based on market values, we
had 68.2% of our derivative contracts with three financial institutions, each with more than 10% of our total
exposure.
F-30