Virgin Media 2010 Annual Report Download - page 207
Download and view the complete annual report
Please find page 207 of the 2010 Virgin Media annual report below. You can navigate through the pages in the report by either clicking on the pages listed below, or by using the keyword search tool below to find specific information within the annual report.-
 1
1 -
2
-
3
-
4
-
5
-
6
-
7
-
8
-
9
-
10
-
11
-
12
-
13
-
14
-
15
-
16
-
17
-
18
-
19
-
20
-
21
-
22
-
23
-
24
-
25
-
26
-
27
-
28
-
29
-
30
-
31
-
32
-
33
-
34
-
35
-
36
-
37
-
38
-
39
-
40
-
41
-
42
-
43
-
44
-
45
-
46
-
47
-
48
-
49
-
50
-
51
-
52
-
53
-
54
-
55
-
56
-
57
-
58
-
59
-
60
-
61
-
62
-
63
-
64
-
65
-
66
-
67
-
68
-
69
-
70
-
71
-
72
-
73
-
74
-
75
-
76
-
77
-
78
-
79
-
80
-
81
-
82
-
83
-
84
-
85
-
86
-
87
-
88
-
89
-
90
-
91
-
92
-
93
-
94
-
95
-
96
-
97
-
98
-
99
-
100
-
101
-
102
-
103
-
104
-
105
-
106
-
107
-
108
-
109
-
110
-
111
-
112
-
113
-
114
-
115
-
116
-
117
-
118
-
119
-
120
-
121
-
122
-
123
-
124
-
125
-
126
-
127
-
128
-
129
-
130
-
131
-
132
-
133
-
134
-
135
-
136
-
137
-
138
-
139
-
140
-
141
-
142
-
143
-
144
-
145
-
146
-
147
-
148
-
149
-
150
-
151
-
152
-
153
-
154
-
155
-
156
-
157
-
158
-
159
-
160
-
161
-
162
-
163
-
164
-
165
-
166
-
167
-
168
-
169
-
170
-
171
-
172
-
173
-
174
-
175
-
176
-
177
-
178
-
179
-
180
-
181
-
182
-
183
-
184
-
185
-
186
-
187
-
188
-
189
-
190
-
191
-
192
-
193
-
194
-
195
-
196
-
 197
197 -
 198
198 -
 199
199 -
 200
200 -
 201
201 -
 202
202 -
 203
203 -
 204
204 -
 205
205 -
 206
206 -
 207
207 -
 208
208 -
 209
209 -
 210
210 -
 211
211 -
 212
212 -
 213
213 -
 214
214 -
 215
215 -
 216
216 -
 217
217 -
218
-
219
-
220
-
221
-
222
-
223
-
224
-
225
-
226
-
227
-
228
-
229
-
230
-
231
-
232
-
233
-
234
-
235
-
236
-
237
-
238
-
239
-
240
-
241
-
242
-
243
 |
 |

VIRGIN MEDIA INVESTMENT HOLDINGS LIMITED AND SUBSIDIARIES
VIRGIN MEDIA INVESTMENTS LIMITED AND SUBSIDIARIES
COMBINED NOTES TO THE CONSOLIDATED FINANCIAL STATEMENTS (continued)
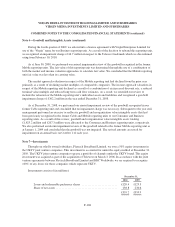
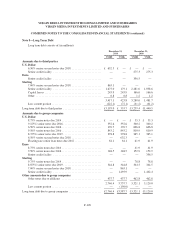
Note 8—Long Term Debt (continued)
• merge or consolidate or transfer all or substantially all of our assets; and
• enter into transactions with affiliates.
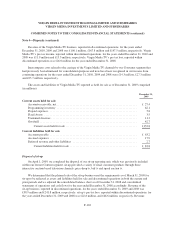
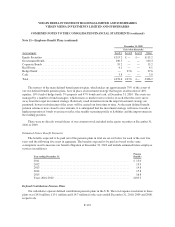
Long term debt repayments, excluding capital leases as of December 31, 2010, are due as follows (in
millions):
Period ending December 31:
2011 ............................................. £ 150.3
2012 ............................................. 239.4
2013 ............................................. 200.1
2014 ............................................. 200.0
2015 ............................................. 950.0
Thereafter ........................................ 4,237.3
Total debt payments ................................ £5,977.1
Note 9—Fair Value Measurements
U.S. GAAP defines fair value as the price that would be received to sell an asset or paid to transfer a
liability in an orderly transaction between market participants at the measurement date (exit price). The inputs
used to measure fair value are classified into the following hierarchy:
Level 1 Unadjusted quoted prices in active markets for identical assets or liabilities
Level 2 Unadjusted quoted prices in active markets for similar assets or liabilities, or
Unadjusted quoted prices for identical or similar assets or liabilities in markets that are not active, or
Inputs other than quoted prices that are observable for the asset or liability
Level 3 Unobservable inputs for the asset or liability
We endeavor to utilize the best available information in measuring fair value. Financial assets and liabilities
are classified in their entirety based on the lowest level of input that is significant to the fair value measurement.
We have determined that all of our financial assets and liabilities that are stated at fair value fall in levels 1 and 2
in the fair value hierarchy described above.
In estimating the fair value of our other financial instruments, we used the following methods and
assumptions:
Cash and cash equivalents, and restricted cash: The carrying amounts reported in the consolidated balance
sheets approximate fair value due to the short maturity and nature of these financial instruments.
Derivative financial instruments: As a result of our financing activities, we are exposed to market risks from
changes in interest and foreign currency exchange rates, which may adversely affect our operating results and
financial position. When deemed appropriate, we minimize our risks from interest and foreign currency exchange
rate fluctuations through the use of derivative financial instruments. The foreign currency forward rate contracts,
interest rate swaps and cross-currency interest rate swaps are valued using counterparty valuations, or market
F-112