Virgin Media 2010 Annual Report Download - page 185
Download and view the complete annual report
Please find page 185 of the 2010 Virgin Media annual report below. You can navigate through the pages in the report by either clicking on the pages listed below, or by using the keyword search tool below to find specific information within the annual report.-
 1
1 -
2
-
3
-
4
-
5
-
6
-
7
-
8
-
9
-
10
-
11
-
12
-
13
-
14
-
15
-
16
-
17
-
18
-
19
-
20
-
21
-
22
-
23
-
24
-
25
-
26
-
27
-
28
-
29
-
30
-
31
-
32
-
33
-
34
-
35
-
36
-
37
-
38
-
39
-
40
-
41
-
42
-
43
-
44
-
45
-
46
-
47
-
48
-
49
-
50
-
51
-
52
-
53
-
54
-
55
-
56
-
57
-
58
-
59
-
60
-
61
-
62
-
63
-
64
-
65
-
66
-
67
-
68
-
69
-
70
-
71
-
72
-
73
-
74
-
75
-
76
-
77
-
78
-
79
-
80
-
81
-
82
-
83
-
84
-
85
-
86
-
87
-
88
-
89
-
90
-
91
-
92
-
93
-
94
-
95
-
96
-
97
-
98
-
99
-
100
-
101
-
102
-
103
-
104
-
105
-
106
-
107
-
108
-
109
-
110
-
111
-
112
-
113
-
114
-
115
-
116
-
117
-
118
-
119
-
120
-
121
-
122
-
123
-
124
-
125
-
126
-
127
-
128
-
129
-
130
-
131
-
132
-
133
-
134
-
135
-
136
-
137
-
138
-
139
-
140
-
141
-
142
-
143
-
144
-
145
-
146
-
147
-
148
-
149
-
150
-
151
-
152
-
153
-
154
-
155
-
156
-
157
-
158
-
159
-
160
-
161
-
162
-
163
-
164
-
165
-
166
-
167
-
168
-
169
-
170
-
171
-
172
-
173
-
174
-
 175
175 -
 176
176 -
 177
177 -
 178
178 -
 179
179 -
 180
180 -
 181
181 -
 182
182 -
 183
183 -
 184
184 -
 185
185 -
 186
186 -
 187
187 -
 188
188 -
 189
189 -
 190
190 -
 191
191 -
 192
192 -
 193
193 -
 194
194 -
 195
195 -
196
-
197
-
198
-
199
-
200
-
201
-
202
-
203
-
204
-
205
-
206
-
207
-
208
-
209
-
210
-
211
-
212
-
213
-
214
-
215
-
216
-
217
-
218
-
219
-
220
-
221
-
222
-
223
-
224
-
225
-
226
-
227
-
228
-
229
-
230
-
231
-
232
-
233
-
234
-
235
-
236
-
237
-
238
-
239
-
240
-
241
-
242
-
243
 |
 |

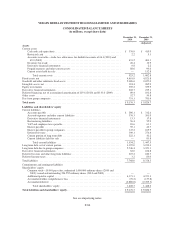
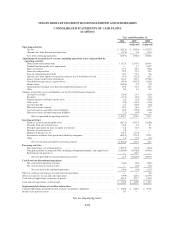
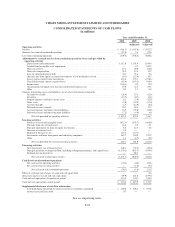
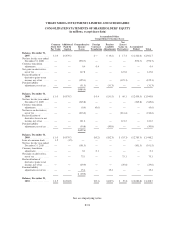
VIRGIN MEDIA INVESTMENTS LIMITED AND SUBSIDIARIES
CONSOLIDATED STATEMENTS OF CASH FLOWS
(in millions)
Year ended December 31,
2010 2009 2008
(Adjusted) (Adjusted)
Operating activities
Net loss .......................................................................... £ (101.5) £ (345.8) £ (972.7)
(Income) loss from discontinued operations ............................................. (27.8) 7.6 92.6
Loss from continuing operations ...................................................... (129.3) (338.2) (880.1)
Adjustments to reconcile net loss from continuing operations to net cash pro vided by
operating activities:
Depreciation and amortization .................................................... 1,112.8 1,151.0 1,160.4
Goodwill and intangible asset impairments .......................................... — 4.7 362.2
Non-cash interest .............................................................. 17.1 20.0 (58.6)
Non-cash compensation . ........................................................ 25.9 15.4 13.2
Loss on extinguishment of debt ................................................... 70.1 53.6 9.6
(Income) loss from equity accounted investments, net of dividends received ................ (9.3) (12.4) 10.7
Losses (gains) on derivative instruments ............................................ 116.4 133.3 (278.1)
Unrealized foreign currency (gains) losses .......................................... (85.4) (163.2) 414.0
Income taxes .................................................................. (104.4) 4.2 (2.2)
Amortization of original issue discount and deferred finance costs ....................... 19.0 32.3 23.5
Other ........................................................................ 0.5 1.3 0.4
Changes in operating assets and liabilities, net of effect from business disposals:
Accounts receivable ............................................................ (28.4) 27.5 (12.9)
Inventory .................................................................... (13.5) (0.3) (4.4)
Prepaid expenses and other current assets ........................................... 6.2 (2.6) (12.9)
Other assets .................................................................. (2.0) (14.9) (11.0)
Accounts payable .............................................................. 4.5 (14.9) (6.0)
Deferred revenue (current) ....................................................... 25.3 18.4 17.7
Accrued expenses and other current liabilities ........................................ 16.9 (35.8) (32.8)
Deferred revenue and other long term liabilities ...................................... (7.2) (4.9) 4.0
Net cash provided by operating activities ....................................... 1,035.2 874.5 716.7
Investing activities:
Purchase of fixed and intangible assets ............................................. (617.3) (555.7) (468.9)
Proceeds from sale of fixed assets ................................................. 36.0 4.2 2.1
Principal repayments on loans to equity investments .................................. 8.4 12.5 8.6
Decrease in restricted cash ....................................................... 3.0 — —
Disposal of businesses, net ....................................................... 167.4 (17.5) —
Investments and loans from parent and subsidiary companies ........................... 587.2 740.9 235.2
Other ........................................................................ 1.4 (2.5) (1.5)
Net cash provided by (used in) investing activities ................................ 186.1 181.9 (224.5)
Financing activities:
New borrowings, net of financing fees ............................................. 108.1 (52.6) (49.0)
Principal payments on long term debt, including redemption premiums, and capital leases ..... (1,339.2) (845.1) (559.4)
Realized gain on derivatives ..................................................... — 88.3 —
Net cash used in financing activities ........................................... (1,231.1) (809.4) (608.4)
Cash flow from discontinued operations:
Net cash used in operating activities ............................................... (30.1) (0.8) (20.1)
Net cash used in investing activities ............................................... — (1.0) (3.4)
Net cash used in discontinued operations ....................................... (30.1) (1.8) (23.5)
Effect of exchange rate changes on cash and cash equivalents ............................... — — 0.4
(Decrease) increase in cash and cash equivalents ......................................... (39.9) 245.2 (139.3)
Cash and cash equivalents, beginning of period .......................................... 415.9 170.7 310.0
Cash and cash equivalents, end of period ............................................... £ 376.0 £ 415.9 £ 170.7
Supplemental disclosure of cash flow information
Cash paid during the period for interest exclusive of amounts capitalized .................. £ 180.8 £ 248.3 £ 391.8
Income taxes paid (received) ..................................................... 0.7 — —
See accompanying notes.
F-90