Virgin Media 2010 Annual Report Download - page 136
Download and view the complete annual report
Please find page 136 of the 2010 Virgin Media annual report below. You can navigate through the pages in the report by either clicking on the pages listed below, or by using the keyword search tool below to find specific information within the annual report.-
 1
1 -
2
-
3
-
4
-
5
-
6
-
7
-
8
-
9
-
10
-
11
-
12
-
13
-
14
-
15
-
16
-
17
-
18
-
19
-
20
-
21
-
22
-
23
-
24
-
25
-
26
-
27
-
28
-
29
-
30
-
31
-
32
-
33
-
34
-
35
-
36
-
37
-
38
-
39
-
40
-
41
-
42
-
43
-
44
-
45
-
46
-
47
-
48
-
49
-
50
-
51
-
52
-
53
-
54
-
55
-
56
-
57
-
58
-
59
-
60
-
61
-
62
-
63
-
64
-
65
-
66
-
67
-
68
-
69
-
70
-
71
-
72
-
73
-
74
-
75
-
76
-
77
-
78
-
79
-
80
-
81
-
82
-
83
-
84
-
85
-
86
-
87
-
88
-
89
-
90
-
91
-
92
-
93
-
94
-
95
-
96
-
97
-
98
-
99
-
100
-
101
-
102
-
103
-
104
-
105
-
106
-
107
-
108
-
109
-
110
-
111
-
112
-
113
-
114
-
115
-
116
-
117
-
118
-
119
-
120
-
121
-
122
-
123
-
124
-
125
-
 126
126 -
 127
127 -
 128
128 -
 129
129 -
 130
130 -
 131
131 -
 132
132 -
 133
133 -
 134
134 -
 135
135 -
 136
136 -
 137
137 -
 138
138 -
 139
139 -
 140
140 -
 141
141 -
 142
142 -
 143
143 -
 144
144 -
 145
145 -
 146
146 -
147
-
148
-
149
-
150
-
151
-
152
-
153
-
154
-
155
-
156
-
157
-
158
-
159
-
160
-
161
-
162
-
163
-
164
-
165
-
166
-
167
-
168
-
169
-
170
-
171
-
172
-
173
-
174
-
175
-
176
-
177
-
178
-
179
-
180
-
181
-
182
-
183
-
184
-
185
-
186
-
187
-
188
-
189
-
190
-
191
-
192
-
193
-
194
-
195
-
196
-
197
-
198
-
199
-
200
-
201
-
202
-
203
-
204
-
205
-
206
-
207
-
208
-
209
-
210
-
211
-
212
-
213
-
214
-
215
-
216
-
217
-
218
-
219
-
220
-
221
-
222
-
223
-
224
-
225
-
226
-
227
-
228
-
229
-
230
-
231
-
232
-
233
-
234
-
235
-
236
-
237
-
238
-
239
-
240
-
241
-
242
-
243
 |
 |

VIRGIN MEDIA INC. AND SUBSIDIARIES
NOTES TO CONSOLIDATED FINANCIAL STATEMENTS (continued)
Note 12—Employee Benefit Plans (continued)
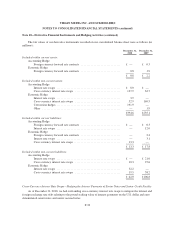
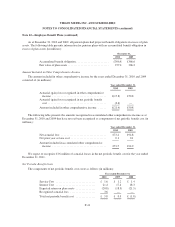
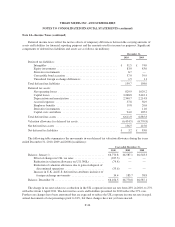
As at December 31, 2010 and 2009, all pension plans had projected benefit obligations in excess of plan
assets. The following table presents information for pension plans with an accumulated benefit obligation in
excess of plan assets (in millions):
December 31,
2010 2009
Accumulated benefit obligation ....................... £306.8 £366.6
Fair value of plan assets ............................. 277.4 306.2
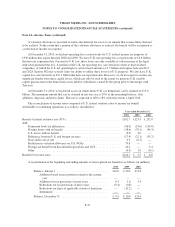
Amount Included in Other Comprehensive Income
The amount included in other comprehensive income for the years ended December 31, 2010 and 2009
consisted of (in millions):
Year ended December 31,
2010 2009
Actuarial (gain) loss recognized in other comprehensive
income ...................................... £(17.8) £50.8
Actuarial (gain) loss recognized in net periodic benefit
cost ......................................... (3.6) —
Amount included in other comprehensive income ...... £(21.4) £50.8
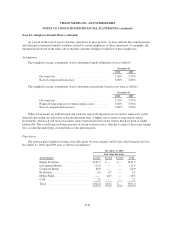
The following table presents the amounts recognized in accumulated other comprehensive income as at
December 31, 2010 and 2009 that have not yet been recognized as components of net periodic benefit cost (in
millions):
Year ended December 31,
2010 2009
Net actuarial loss ................................ £73.4 £94.8
Net prior year service cost ......................... 0.1 0.1
Amount included in accumulated other comprehensive
income ...................................... £73.5 £94.9
We expect to recognize £3.6 million of actuarial losses in the net periodic benefit cost for the year ended
December 31, 2011.
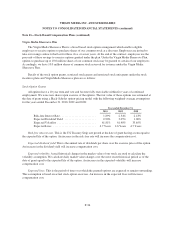
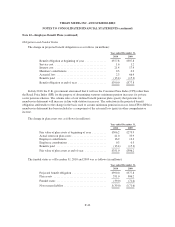
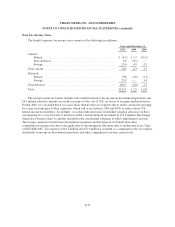
Net Periodic Benefit Costs
The components of net periodic benefit costs were as follows (in millions):
Year ended December 31,
2010 2009 2008
Service Cost ............................ £ 1.6 £ 1.2 £ 1.4
Interest Cost ............................ 21.4 17.4 18.3
Expected return on plan assets .............. (20.8) (18.3) (21.5)
Recognised actuarial loss .................. 3.6 — —
Total net periodic benefit cost .............. £ 5.8 £ 0.3 £ (1.8)
F-41