Virgin Media 2010 Annual Report Download - page 43
Download and view the complete annual report
Please find page 43 of the 2010 Virgin Media annual report below. You can navigate through the pages in the report by either clicking on the pages listed below, or by using the keyword search tool below to find specific information within the annual report.-
 1
1 -
 2
2 -
 3
3 -
 4
4 -
 5
5 -
 6
6 -
 7
7 -
 8
8 -
 9
9 -
 10
10 -
 11
11 -
 12
12 -
 13
13 -
 14
14 -
 15
15 -
 16
16 -
 17
17 -
 18
18 -
 19
19 -
 20
20 -
 21
21 -
 22
22 -
 23
23 -
 24
24 -
 25
25 -
 26
26 -
 27
27 -
 28
28 -
 29
29 -
 30
30 -
 31
31 -
 32
32 -
 33
33 -
 34
34 -
 35
35 -
 36
36 -
 37
37 -
 38
38 -
 39
39 -
 40
40 -
 41
41 -
 42
42 -
 43
43 -
 44
44 -
 45
45 -
 46
46 -
 47
47 -
 48
48 -
 49
49 -
 50
50 -
 51
51 -
 52
52 -
 53
53 -
 54
54 -
 55
55 -
 56
56 -
 57
57 -
 58
58 -
 59
59 -
 60
60 -
 61
61 -
 62
62 -
 63
63 -
 64
64 -
 65
65 -
 66
66 -
 67
67 -
 68
68 -
 69
69 -
 70
70 -
 71
71 -
 72
72 -
 73
73 -
 74
74 -
 75
75 -
 76
76 -
 77
77 -
 78
78 -
 79
79 -
 80
80 -
 81
81 -
 82
82 -
 83
83 -
 84
84 -
 85
85 -
 86
86 -
 87
87 -
 88
88 -
 89
89 -
 90
90 -
 91
91 -
 92
92 -
 93
93 -
 94
94 -
 95
95 -
 96
96 -
 97
97 -
 98
98 -
 99
99 -
 100
100 -
 101
101 -
 102
102 -
 103
103 -
 104
104 -
 105
105 -
 106
106 -
 107
107 -
 108
108 -
 109
109 -
 110
110 -
 111
111 -
 112
112 -
 113
113 -
 114
114 -
 115
115 -
 116
116 -
 117
117 -
 118
118 -
 119
119 -
 120
120 -
 121
121 -
 122
122 -
 123
123 -
 124
124 -
 125
125 -
 126
126 -
 127
127 -
 128
128 -
 129
129 -
 130
130 -
 131
131 -
 132
132 -
 133
133 -
 134
134 -
 135
135 -
 136
136 -
 137
137 -
 138
138 -
 139
139 -
 140
140 -
 141
141 -
 142
142 -
 143
143 -
 144
144 -
 145
145 -
 146
146 -
 147
147 -
 148
148 -
 149
149 -
 150
150 -
 151
151 -
 152
152 -
 153
153 -
 154
154 -
 155
155 -
 156
156 -
 157
157 -
 158
158 -
 159
159 -
 160
160 -
 161
161 -
 162
162 -
 163
163 -
 164
164 -
 165
165 -
 166
166 -
 167
167 -
 168
168 -
 169
169 -
 170
170 -
 171
171 -
 172
172 -
 173
173 -
 174
174 -
 175
175 -
 176
176 -
 177
177 -
 178
178 -
 179
179 -
 180
180 -
 181
181 -
 182
182 -
 183
183 -
 184
184 -
 185
185 -
 186
186 -
 187
187 -
 188
188 -
 189
189 -
 190
190 -
 191
191 -
 192
192 -
 193
193 -
 194
194 -
 195
195 -
 196
196 -
 197
197 -
 198
198 -
 199
199 -
 200
200 -
 201
201 -
 202
202 -
 203
203 -
 204
204 -
 205
205 -
 206
206 -
 207
207 -
 208
208 -
 209
209 -
 210
210 -
 211
211 -
 212
212 -
 213
213 -
 214
214 -
 215
215 -
 216
216 -
 217
217 -
 218
218 -
 219
219 -
 220
220 -
 221
221 -
 222
222 -
 223
223 -
 224
224 -
 225
225 -
 226
226 -
 227
227 -
 228
228 -
 229
229 -
 230
230 -
 231
231 -
 232
232 -
 233
233 -
 234
234 -
 235
235 -
 236
236 -
 237
237 -
 238
238 -
 239
239 -
 240
240 -
 241
241 -
 242
242 -
 243
243
 |
 |

Stock Performance
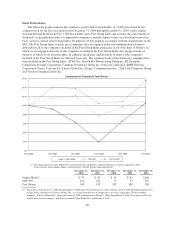
The following graph compares the cumulative total return to stockholders of a $100 investment in our
common stock for the five-year period from December 31, 2006 through December 31, 2010, with a similar
investment in the Standard & Poor’s 500 Stock Index and a Peer Group Index and assumes the reinvestment of
dividends. As no published index of comparable companies currently reports values on a dividends reinvested
basis, we have created a Peer Group Index for purposes of this graph in accordance with the requirements of the
SEC. The Peer Group Index is made up of companies that are engaged in the telecommunications business,
although not all of the companies included in the Peer Group Index participate in all of the lines of business in
which we are engaged and some of the companies included in the Peer Group Index also engage in lines of
business in which we do not participate. In addition, the market capitalizations of many of the companies
included in the Peer Group Index are different from ours. The common stocks of the following companies have
been included in the Peer Group Index: AT&T Inc., British Sky Broadcasting Group plc, BT Group plc,
Cablevision Systems Corporation, Carphone Warehouse Group plc, Comcast Corporation, DISH Network
Corporation, France Telecom SA, Liberty Global Inc., Rogers Communication Inc., Talk Talk Telephone Group
and Verizon Communications Inc.
01/01/2006 12/31/2006 12/31/2007 12/31/2008 12/31/2009 12/31/2010
$0
$20
$40
$60
$80
$100
$120
$140
$160 Comparison of Cumulative Total Return
Virgin Media S&P 500 Peer Group(1)
(1) Peer Group consists of AT&T, BSkyB, BT, Cablevision Systems Corporation, Carphone Warehouse, Comcast Corporation, DISH,
France Telecom, Liberty Global, Rogers Communications, TalkTalk Telecom Group and Verizon.
December 31,
2006
December 31,
2007
December 31,
2008
December 31,
2009
December 31,
2010
Virgin Media(1) ...................... $ 93 $ 63 $ 19 $ 65 $106
S&P500 ........................... 116 122 77 97 112
Peer Group ......................... 140 139 105 109 156
(1) Share prices from January 1, 2006 through March 3, 2006 reflect the historic prices of the common stock of NTL Incorporated prior to its
merger into a subsidiary of Telewest Global, Inc., in a transaction that was accounted for as a reverse acquisition. The new holding
company, Telewest Global, Inc., changed its name to NTL Incorporated on March 3, 2006. From March 6, 2006, share prices reflect the
market price for that company, which was renamed Virgin Media Inc. on February 6, 2007.
40
