Virgin Media 2010 Annual Report Download - page 74
Download and view the complete annual report
Please find page 74 of the 2010 Virgin Media annual report below. You can navigate through the pages in the report by either clicking on the pages listed below, or by using the keyword search tool below to find specific information within the annual report.-
 1
1 -
2
-
3
-
4
-
5
-
6
-
7
-
8
-
9
-
10
-
11
-
12
-
13
-
14
-
15
-
16
-
17
-
18
-
19
-
20
-
21
-
22
-
23
-
24
-
25
-
26
-
27
-
28
-
29
-
30
-
31
-
32
-
33
-
34
-
35
-
36
-
37
-
38
-
39
-
40
-
41
-
42
-
43
-
44
-
45
-
46
-
47
-
48
-
49
-
50
-
51
-
52
-
53
-
54
-
55
-
56
-
57
-
58
-
59
-
60
-
61
-
62
-
63
-
 64
64 -
 65
65 -
 66
66 -
 67
67 -
 68
68 -
 69
69 -
 70
70 -
 71
71 -
 72
72 -
 73
73 -
 74
74 -
 75
75 -
 76
76 -
 77
77 -
 78
78 -
 79
79 -
 80
80 -
 81
81 -
 82
82 -
 83
83 -
 84
84 -
85
-
86
-
87
-
88
-
89
-
90
-
91
-
92
-
93
-
94
-
95
-
96
-
97
-
98
-
99
-
100
-
101
-
102
-
103
-
104
-
105
-
106
-
107
-
108
-
109
-
110
-
111
-
112
-
113
-
114
-
115
-
116
-
117
-
118
-
119
-
120
-
121
-
122
-
123
-
124
-
125
-
126
-
127
-
128
-
129
-
130
-
131
-
132
-
133
-
134
-
135
-
136
-
137
-
138
-
139
-
140
-
141
-
142
-
143
-
144
-
145
-
146
-
147
-
148
-
149
-
150
-
151
-
152
-
153
-
154
-
155
-
156
-
157
-
158
-
159
-
160
-
161
-
162
-
163
-
164
-
165
-
166
-
167
-
168
-
169
-
170
-
171
-
172
-
173
-
174
-
175
-
176
-
177
-
178
-
179
-
180
-
181
-
182
-
183
-
184
-
185
-
186
-
187
-
188
-
189
-
190
-
191
-
192
-
193
-
194
-
195
-
196
-
197
-
198
-
199
-
200
-
201
-
202
-
203
-
204
-
205
-
206
-
207
-
208
-
209
-
210
-
211
-
212
-
213
-
214
-
215
-
216
-
217
-
218
-
219
-
220
-
221
-
222
-
223
-
224
-
225
-
226
-
227
-
228
-
229
-
230
-
231
-
232
-
233
-
234
-
235
-
236
-
237
-
238
-
239
-
240
-
241
-
242
-
243
 |
 |

(1) Mobile customer information is for active customers. Prepay customers are defined as active customers if they have made an outbound
call or text in the preceding 30 days. Contract customers are defined as active customers if they have entered into a contract with Virgin
Mobile for a minimum 30-day period and have not been disconnected. Contract mobile customers include customers who have taken
either a mobile service or a mobile broadband contract.
(2) Mobile monthly average revenue per user, or Mobile ARPU, is calculated on a quarterly basis by dividing mobile service revenue
(contract and prepay) for the period by the average number of active customers (contract and prepay) for the period, divided by three.
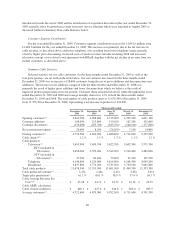
Summary Non-cable Statistics
Selected statistics for our residential customers that are not connected directly through our cable network, or
non-cable customers, for the three months ended December 31, 2009 as well as for the four prior quarters, are set
forth in the table below. Total non-cable products increased by 48,000 during the year ended December 31, 2009.
This increase in non-cable products is primarily due to improvements in both broadband and telephone net
additions due to the launch of wholesale line rental in August which allows us to offer telephone line rental
services bundled with our broadband services, which we believe makes our products more attractive to our
customers, and new flexible customer propositions.
Three months ended
December 31,
2009
September 30,
2009
June 30,
2009
March 31,
2009
December 31,
2008
Opening customers ....................... 255,200 245,500 247,100 251,900 260,200
Net customer movements .................. 12,000 9,700 (1,600) (4,800) (8,300)
Closing customers ........................ 267,200 255,200 245,500 247,100 251,900
Opening Non-cable products:
Telephone .......................... 124,900 112,500 109,000 105,500 104,900
Broadband .......................... 253,200 245,700 247,000 252,000 260,100
378,100 358,200 356,000 357,500 365,000
Net Non-cable product additions
(disconnections):
Telephone .......................... 14,900 12,400 3,500 3,500 600
Broadband .......................... 12,500 7,500 (1,300) (5,000) (8,100)
27,400 19,900 2,200 (1,500) (7,500)
Closing Non-cable products:
Telephone .......................... 139,800 124,900 112,500 109,000 105,500
Broadband .......................... 265,700 253,200 245,700 247,000 252,000
405,500 378,100 358,200 356,000 357,500
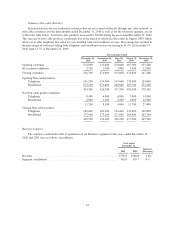
Business Segment
The summary combined results of operations of our Business segment for the years ended December 31,
2009 and 2008 were as follows (in millions):
Year ended
December 31,
2009 2008
Revenue ................................................... £580.8 £626.0
Inter segment revenue ........................................ — 0.4
Segment contribution… ...................................... £339.7 £335.2
71