Virgin Media 2010 Annual Report Download - page 215
Download and view the complete annual report
Please find page 215 of the 2010 Virgin Media annual report below. You can navigate through the pages in the report by either clicking on the pages listed below, or by using the keyword search tool below to find specific information within the annual report.-
 1
1 -
2
-
3
-
4
-
5
-
6
-
7
-
8
-
9
-
10
-
11
-
12
-
13
-
14
-
15
-
16
-
17
-
18
-
19
-
20
-
21
-
22
-
23
-
24
-
25
-
26
-
27
-
28
-
29
-
30
-
31
-
32
-
33
-
34
-
35
-
36
-
37
-
38
-
39
-
40
-
41
-
42
-
43
-
44
-
45
-
46
-
47
-
48
-
49
-
50
-
51
-
52
-
53
-
54
-
55
-
56
-
57
-
58
-
59
-
60
-
61
-
62
-
63
-
64
-
65
-
66
-
67
-
68
-
69
-
70
-
71
-
72
-
73
-
74
-
75
-
76
-
77
-
78
-
79
-
80
-
81
-
82
-
83
-
84
-
85
-
86
-
87
-
88
-
89
-
90
-
91
-
92
-
93
-
94
-
95
-
96
-
97
-
98
-
99
-
100
-
101
-
102
-
103
-
104
-
105
-
106
-
107
-
108
-
109
-
110
-
111
-
112
-
113
-
114
-
115
-
116
-
117
-
118
-
119
-
120
-
121
-
122
-
123
-
124
-
125
-
126
-
127
-
128
-
129
-
130
-
131
-
132
-
133
-
134
-
135
-
136
-
137
-
138
-
139
-
140
-
141
-
142
-
143
-
144
-
145
-
146
-
147
-
148
-
149
-
150
-
151
-
152
-
153
-
154
-
155
-
156
-
157
-
158
-
159
-
160
-
161
-
162
-
163
-
164
-
165
-
166
-
167
-
168
-
169
-
170
-
171
-
172
-
173
-
174
-
175
-
176
-
177
-
178
-
179
-
180
-
181
-
182
-
183
-
184
-
185
-
186
-
187
-
188
-
189
-
190
-
191
-
192
-
193
-
194
-
195
-
196
-
197
-
198
-
199
-
200
-
201
-
202
-
203
-
204
-
 205
205 -
 206
206 -
 207
207 -
 208
208 -
 209
209 -
 210
210 -
 211
211 -
 212
212 -
 213
213 -
 214
214 -
 215
215 -
 216
216 -
 217
217 -
 218
218 -
 219
219 -
 220
220 -
 221
221 -
 222
222 -
 223
223 -
 224
224 -
 225
225 -
226
-
227
-
228
-
229
-
230
-
231
-
232
-
233
-
234
-
235
-
236
-
237
-
238
-
239
-
240
-
241
-
242
-
243
 |
 |

VIRGIN MEDIA INVESTMENT HOLDINGS LIMITED AND SUBSIDIARIES
VIRGIN MEDIA INVESTMENTS LIMITED AND SUBSIDIARIES
COMBINED NOTES TO THE CONSOLIDATED FINANCIAL STATEMENTS (continued)
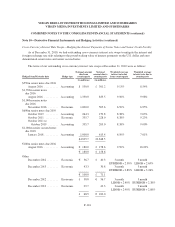
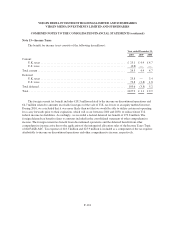
Note 11—Employee Benefit Plans (continued)
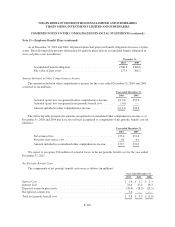
As at December 31, 2010 and 2009, all pension plans had projected benefit obligations in excess of plan
assets. The following table presents information for pension plans with an accumulated benefit obligation in
excess of plan assets (in millions):
December 31,
2010 2009
Accumulated benefit obligation ............................... £306.8 £366.6
Fair value of plan assets ..................................... 277.4 306.2
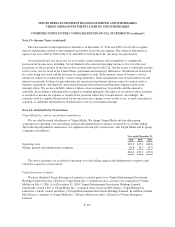
Amount Included in Other Comprehensive Income
The amount included in other comprehensive income for the years ended December 31, 2010 and 2009
consisted of (in millions):
Year ended December 31,
2010 2009
Actuarial (gain) loss recognized in other comprehensive income . . . £(17.8) £50.8
Actuarial (gain) loss recognized in net periodic benefit cost ....... (3.6) —
Amount included in other comprehensive income .............. £(21.4) £50.8
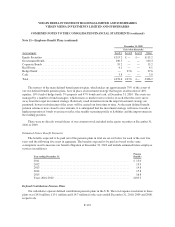
The following table presents the amounts recognized in accumulated other comprehensive income as at
December 31, 2010 and 2009 that have not yet been recognized as components of net periodic benefit cost (in
millions):
Year ended December 31,
2010 2009
Net actuarial loss ........................................ £73.4 £94.8
Net prior year service cost ................................. 0.1 0.1
Amount included in accumulated other comprehensive income .... £73.5 £94.9
We expect to recognize £3.6 million of actuarial losses in the net periodic benefit cost for the year ended
December 31, 2011.
Net Periodic Benefit Costs
The components of net periodic benefit costs were as follows (in millions):
Year ended December 31,
2010 2009 2008
Service Cost ........................................................... £ 1.6 £ 1.2 £ 1.4
Interest Cost ........................................................... 21.4 17.4 18.3
Expected return on plan assets ............................................. (20.8) (18.3) (21.5)
Recognised acturial loss .................................................. 3.6 — —
Total net periodic benefit cost ............................................. £ 5.8 £ 0.3 £ (1.8)
F-120