Virgin Media 2010 Annual Report Download - page 55
Download and view the complete annual report
Please find page 55 of the 2010 Virgin Media annual report below. You can navigate through the pages in the report by either clicking on the pages listed below, or by using the keyword search tool below to find specific information within the annual report.-
 1
1 -
2
-
3
-
4
-
5
-
6
-
7
-
8
-
9
-
10
-
11
-
12
-
13
-
14
-
15
-
16
-
17
-
18
-
19
-
20
-
21
-
22
-
23
-
24
-
25
-
26
-
27
-
28
-
29
-
30
-
31
-
32
-
33
-
34
-
35
-
36
-
37
-
38
-
39
-
40
-
41
-
42
-
43
-
44
-
 45
45 -
 46
46 -
 47
47 -
 48
48 -
 49
49 -
 50
50 -
 51
51 -
 52
52 -
 53
53 -
 54
54 -
 55
55 -
 56
56 -
 57
57 -
 58
58 -
 59
59 -
 60
60 -
 61
61 -
 62
62 -
 63
63 -
 64
64 -
 65
65 -
66
-
67
-
68
-
69
-
70
-
71
-
72
-
73
-
74
-
75
-
76
-
77
-
78
-
79
-
80
-
81
-
82
-
83
-
84
-
85
-
86
-
87
-
88
-
89
-
90
-
91
-
92
-
93
-
94
-
95
-
96
-
97
-
98
-
99
-
100
-
101
-
102
-
103
-
104
-
105
-
106
-
107
-
108
-
109
-
110
-
111
-
112
-
113
-
114
-
115
-
116
-
117
-
118
-
119
-
120
-
121
-
122
-
123
-
124
-
125
-
126
-
127
-
128
-
129
-
130
-
131
-
132
-
133
-
134
-
135
-
136
-
137
-
138
-
139
-
140
-
141
-
142
-
143
-
144
-
145
-
146
-
147
-
148
-
149
-
150
-
151
-
152
-
153
-
154
-
155
-
156
-
157
-
158
-
159
-
160
-
161
-
162
-
163
-
164
-
165
-
166
-
167
-
168
-
169
-
170
-
171
-
172
-
173
-
174
-
175
-
176
-
177
-
178
-
179
-
180
-
181
-
182
-
183
-
184
-
185
-
186
-
187
-
188
-
189
-
190
-
191
-
192
-
193
-
194
-
195
-
196
-
197
-
198
-
199
-
200
-
201
-
202
-
203
-
204
-
205
-
206
-
207
-
208
-
209
-
210
-
211
-
212
-
213
-
214
-
215
-
216
-
217
-
218
-
219
-
220
-
221
-
222
-
223
-
224
-
225
-
226
-
227
-
228
-
229
-
230
-
231
-
232
-
233
-
234
-
235
-
236
-
237
-
238
-
239
-
240
-
241
-
242
-
243
 |
 |

Consolidated Results of Operations
Consolidated Results of Operations for the Years Ended December 31, 2010 and 2009
Revenue
For the year ended December 31, 2010, revenue increased by 5.8% to £3,875.8 million from
£3,663.9 million for the same period in 2009. This increase was due to higher revenue in both our Consumer and
Business segments. See further discussion of our Consumer and Business segments below.
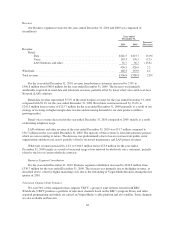
Operating Costs
Operating costs for the years ended December 31, 2010 and 2009 were as follows (in millions):
Year ended
December 31, Increase/
(Decrease)2010 2009
(Adjusted)
Operating costs:
Consumer cost of sales ......................................... £ 997.8 £ 968.9 3.0%
Business cost of sales .......................................... 184.3 180.0 2.4
Network and other operating costs ................................ 392.9 379.8 3.5
Total operating costs ............................................... £1,575.0 £1,528.7 3.0%
For the year ended December 31, 2010, operating costs, including network expenses, increased by 3.0% to
£1,575.0 million from £1,528.7 million during the same period in 2009. This increase was attributable to
increases in Consumer segment and Business segment cost of sales, together with increased network and other
operating costs. Consumer segment cost of sales increased primarily as a result of increased revenues, partially
offset by lower fixed line telephony interconnect costs as a result of lower usage along with lower mobile
telephony interconnect costs as a result of lower wholesale rates. Business cost of sales increased as the impact
on costs of higher retail data and wholesale revenues was only partially offset by lower LAN solutions and retail
voice cost of sales. Network and other operating costs increased primarily as a result of increased employee and
outsourcing costs, partially offset by lower facilities costs primarily due to refunds received of local authority
taxes relating to our network property. As a result of these changes, operating costs as a percentage of revenue
decreased to 40.6% for the year from 41.7% for the year ended December 31, 2009.
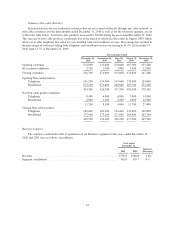
Selling, General and Administrative Expenses
Selling, general and administrative expenses for the year ended December 31, 2010 and 2009 were as
follows (in millions):
Year ended
December 31, Increase/
(Decrease)2010 2009
(Adjusted)
Selling, general and administrative expenses:
Employee and outsourcing costs ................................... £468.5 £449.4 4.3%
Marketing costs ................................................ 147.7 124.7 18.4
Facilities ..................................................... 57.1 71.1 (19.7)
Other ........................................................ 117.3 141.1 (16.9)
Total selling, general and administrative expenses ......................... £790.6 £786.3 0.5%
For the year ended December 31, 2010, selling, general and administrative expenses increased by 0.5% to
£790.6 million from £786.3 million for the year ended December 31, 2009. This increase was primarily
attributable to higher marketing and employee and outsourcing costs, partially offset by lower facilities costs, bad
52