Virgin Media 2010 Annual Report Download - page 44
Download and view the complete annual report
Please find page 44 of the 2010 Virgin Media annual report below. You can navigate through the pages in the report by either clicking on the pages listed below, or by using the keyword search tool below to find specific information within the annual report.-
 1
1 -
2
-
3
-
4
-
5
-
6
-
7
-
8
-
9
-
10
-
11
-
12
-
13
-
14
-
15
-
16
-
17
-
18
-
19
-
20
-
21
-
22
-
23
-
24
-
25
-
26
-
27
-
28
-
29
-
30
-
31
-
32
-
33
-
 34
34 -
 35
35 -
 36
36 -
 37
37 -
 38
38 -
 39
39 -
 40
40 -
 41
41 -
 42
42 -
 43
43 -
 44
44 -
 45
45 -
 46
46 -
 47
47 -
 48
48 -
 49
49 -
 50
50 -
 51
51 -
 52
52 -
 53
53 -
 54
54 -
55
-
56
-
57
-
58
-
59
-
60
-
61
-
62
-
63
-
64
-
65
-
66
-
67
-
68
-
69
-
70
-
71
-
72
-
73
-
74
-
75
-
76
-
77
-
78
-
79
-
80
-
81
-
82
-
83
-
84
-
85
-
86
-
87
-
88
-
89
-
90
-
91
-
92
-
93
-
94
-
95
-
96
-
97
-
98
-
99
-
100
-
101
-
102
-
103
-
104
-
105
-
106
-
107
-
108
-
109
-
110
-
111
-
112
-
113
-
114
-
115
-
116
-
117
-
118
-
119
-
120
-
121
-
122
-
123
-
124
-
125
-
126
-
127
-
128
-
129
-
130
-
131
-
132
-
133
-
134
-
135
-
136
-
137
-
138
-
139
-
140
-
141
-
142
-
143
-
144
-
145
-
146
-
147
-
148
-
149
-
150
-
151
-
152
-
153
-
154
-
155
-
156
-
157
-
158
-
159
-
160
-
161
-
162
-
163
-
164
-
165
-
166
-
167
-
168
-
169
-
170
-
171
-
172
-
173
-
174
-
175
-
176
-
177
-
178
-
179
-
180
-
181
-
182
-
183
-
184
-
185
-
186
-
187
-
188
-
189
-
190
-
191
-
192
-
193
-
194
-
195
-
196
-
197
-
198
-
199
-
200
-
201
-
202
-
203
-
204
-
205
-
206
-
207
-
208
-
209
-
210
-
211
-
212
-
213
-
214
-
215
-
216
-
217
-
218
-
219
-
220
-
221
-
222
-
223
-
224
-
225
-
226
-
227
-
228
-
229
-
230
-
231
-
232
-
233
-
234
-
235
-
236
-
237
-
238
-
239
-
240
-
241
-
242
-
243
 |
 |

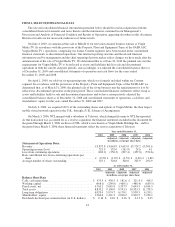
ITEM 6. SELECTED FINANCIAL DATA
The selected consolidated financial information presented below should be read in conjunction with the
consolidated financial statements and notes thereto and the information contained in our Management’s
Discussion and Analysis of Financial Condition and Results of Operations appearing elsewhere in this document.
Historical results are not necessarily indicative of future results.
On June 4, 2010, we announced the sale to BSkyB of our television channel business known as Virgin
Media TV. In accordance with the provisions of the Property, Plant and Equipment Topic of the FASB ASC,
Virgin Media TV’s operations, comprising our former Content segment, have been treated in the consolidated
financial statements as discontinued operations. Our internal reporting structure and the related financial
information used by management and the chief operating decision maker reflect changes we have made after the
announcement of the sale of Virgin Media TV. We determined that as of June 30, 2010 the planned sale met the
requirements for Virgin Media TV to be reflected as assets and liabilities held for sale and discontinued
operations in both the current and prior periods, and accordingly, we adjusted the consolidated balance sheet as
of December 31, 2009 and consolidated statements of operations and cash flows for the years ended
December 31, 2009 and 2008.
On April 1, 2009, we sold our sit-up reporting unit, which was formerly included within our Content
segment. In accordance with the provisions of the Property, Plant and Equipment Topic of the FASB ASC we
determined that, as of March 31, 2009, the planned sale of the sit-up business met the requirements for it to be
reflected as discontinued operations in the prior period. These consolidated financial statements reflect sit-up as
assets and liabilities held for sale and discontinued operations and we have retrospectively adjusted the
consolidated balance sheet as of December 31, 2008 and consolidated statements of operations, cash flows and
shareholders’ equity for the years ended December 31, 2008 and 2007.
On July 4, 2006, we acquired 100% of the outstanding shares and options of Virgin Mobile, the then largest
mobile virtual network operator in the U.K., through a U.K. Scheme of Arrangement.
On March 3, 2006, NTL merged with a subsidiary of Telewest, which changed its name to NTL Incorporated.
As this transaction was accounted for as a reverse acquisition, the financial statements included in this document for
the period through March 3, 2006 are those of NTL, which is now known as Virgin Media Holdings Inc., and for
the period since March 3, 2006, these financial statements reflect the reverse acquisition of Telewest.
Year ended December 31,
2010 2009 2008 2007 2006
(Adjusted) (Adjusted) (Adjusted) (Adjusted)
(in millions, except per share data)
Statement of Operations Data:
Revenue ........................................... £3,875.8 £3,663.9 £3,655.0 £3,729.2 £3,301.6
Operating income (loss) .............................. 321.9 132.0 (261.9) 24.6 4.1
Loss from continuing operations ....................... (169.2) (350.3) (827.4) (457.8) (554.6)
Basic and diluted loss from continuing operations per
share ........................................... £ (0.52) £ (1.07) £ (2.52) £ (1.40) £ (1.89)
Average number of shares outstanding ................... 327.1 328.8 328.0 325.9 292.9
As of December 31,
2010 2009 2008 2007 2006
(Adjusted) (Adjusted) (Adjusted) (Adjusted)
(in millions, except per share data)
Balance Sheet Data
Cash, cash equivalents .............................. £ 479.5 £ 430.5 £ 181.6 £ 321.4 £ 418.5
Working capital ................................... (468.1) (290.9) (460.1) (488.4) (639.5)
Fixed assets, net ................................... 4,763.1 5,045.8 5,337.9 5,644.5 6,014.5
Total assets ....................................... 8,833.2 9,190.0 9,933.3 10,503.3 11,278.5
Long term obligations .............................. 6,020.4 5,974.7 6,170.1 5,958.5 6,159.1
Shareholders’ equity ................................ 1,264.6 1,491.3 2,016.2 2,810.5 3,230.1
Dividends declared per common share (in U.S. dollars) .... $ 0.16 $ 0.16 $ 0.16 $ 0.13 $ 0.05
41