Virgin Media 2010 Annual Report Download - page 41
Download and view the complete annual report
Please find page 41 of the 2010 Virgin Media annual report below. You can navigate through the pages in the report by either clicking on the pages listed below, or by using the keyword search tool below to find specific information within the annual report.-
 1
1 -
2
-
3
-
4
-
5
-
6
-
7
-
8
-
9
-
10
-
11
-
12
-
13
-
14
-
15
-
16
-
17
-
18
-
19
-
20
-
21
-
22
-
23
-
24
-
25
-
26
-
27
-
28
-
29
-
30
-
 31
31 -
 32
32 -
 33
33 -
 34
34 -
 35
35 -
 36
36 -
 37
37 -
 38
38 -
 39
39 -
 40
40 -
 41
41 -
 42
42 -
 43
43 -
 44
44 -
 45
45 -
 46
46 -
 47
47 -
 48
48 -
 49
49 -
 50
50 -
 51
51 -
52
-
53
-
54
-
55
-
56
-
57
-
58
-
59
-
60
-
61
-
62
-
63
-
64
-
65
-
66
-
67
-
68
-
69
-
70
-
71
-
72
-
73
-
74
-
75
-
76
-
77
-
78
-
79
-
80
-
81
-
82
-
83
-
84
-
85
-
86
-
87
-
88
-
89
-
90
-
91
-
92
-
93
-
94
-
95
-
96
-
97
-
98
-
99
-
100
-
101
-
102
-
103
-
104
-
105
-
106
-
107
-
108
-
109
-
110
-
111
-
112
-
113
-
114
-
115
-
116
-
117
-
118
-
119
-
120
-
121
-
122
-
123
-
124
-
125
-
126
-
127
-
128
-
129
-
130
-
131
-
132
-
133
-
134
-
135
-
136
-
137
-
138
-
139
-
140
-
141
-
142
-
143
-
144
-
145
-
146
-
147
-
148
-
149
-
150
-
151
-
152
-
153
-
154
-
155
-
156
-
157
-
158
-
159
-
160
-
161
-
162
-
163
-
164
-
165
-
166
-
167
-
168
-
169
-
170
-
171
-
172
-
173
-
174
-
175
-
176
-
177
-
178
-
179
-
180
-
181
-
182
-
183
-
184
-
185
-
186
-
187
-
188
-
189
-
190
-
191
-
192
-
193
-
194
-
195
-
196
-
197
-
198
-
199
-
200
-
201
-
202
-
203
-
204
-
205
-
206
-
207
-
208
-
209
-
210
-
211
-
212
-
213
-
214
-
215
-
216
-
217
-
218
-
219
-
220
-
221
-
222
-
223
-
224
-
225
-
226
-
227
-
228
-
229
-
230
-
231
-
232
-
233
-
234
-
235
-
236
-
237
-
238
-
239
-
240
-
241
-
242
-
243
 |
 |

PART II
ITEM 5. MARKET FOR REGISTRANT’S COMMON EQUITY, RELATED STOCKHOLDER
MATTERS AND ISSUER PURCHASES OF EQUITY SECURITIES
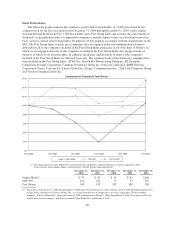
Market Information
The principal market for trading in shares of our common stock is the NASDAQ Global Select Market in
the United States. Our common stock is also listed in the U.K. on the London Stock Exchange. As of
February 18, 2011, there were 113 record holders of our common stock. The following table sets forth the
reported high and low price per share of our common stock on the NASDAQ Global Select Market for the
periods indicated:
Price Per Share
High Low
2009
First Quarter .................................................................. $ 5.49 3.80
Second Quarter ................................................................ 9.35 5.03
Third Quarter .................................................................. 13.92 9.18
Fourth Quarter ................................................................. 17.63 12.90
2010
First Quarter .................................................................. 17.46 14.03
Second Quarter ................................................................ 19.00 14.80
Third Quarter .................................................................. 23.06 16.55
Fourth Quarter ................................................................. 27.58 23.27
2011
First Quarter (through February 18, 2011) ........................................... 28.27 24.14
Dividends
During the years ended December 31, 2009 and 2010, we paid the following dividends:
Board Declaration Date
Per
Share Record Date Payment Date Total Amount
(in millions)
Year ended December 31, 2009:
February 27, 2009 ...................... $0.04 March 12, 2009 March 20, 2009 £9.0
May 29, 2009 ......................... 0.04 June 12, 2009 June 22, 2009 8.0
August 27, 2009 ....................... 0.04 September 11, 2009 September 21, 2009 8.1
November 24, 2009 .................... 0.04 December 11, 2009 December 21, 2009 8.2
Year ended December 31, 2010:
March 2, 2010 ......................... $0.04 March 12, 2010 March 22, 2010 £8.8
May 27, 2010 ......................... 0.04 June 11, 2010 June 21, 2010 9.0
July 23, 2010 .......................... 0.04 September 13, 2010 September 23, 2010 8.2
November 23, 2010 .................... 0.04 December 13, 2010 December 23, 2010 8.1
Future payments of regular quarterly dividends by us are at the discretion of the Board of Directors and will
be subject to our future needs and uses of cash, which could include investments in operations, the repayment of
debt, and stock repurchase programs. In addition, the terms of our and our subsidiaries’ existing and future
indebtedness and the laws of jurisdictions under which those subsidiaries are organized limit the payment of
dividends, loan repayments and other distributions to us under many circumstances.
38