Virgin Media 2010 Annual Report Download - page 77
Download and view the complete annual report
Please find page 77 of the 2010 Virgin Media annual report below. You can navigate through the pages in the report by either clicking on the pages listed below, or by using the keyword search tool below to find specific information within the annual report.-
 1
1 -
2
-
3
-
4
-
5
-
6
-
7
-
8
-
9
-
10
-
11
-
12
-
13
-
14
-
15
-
16
-
17
-
18
-
19
-
20
-
21
-
22
-
23
-
24
-
25
-
26
-
27
-
28
-
29
-
30
-
31
-
32
-
33
-
34
-
35
-
36
-
37
-
38
-
39
-
40
-
41
-
42
-
43
-
44
-
45
-
46
-
47
-
48
-
49
-
50
-
51
-
52
-
53
-
54
-
55
-
56
-
57
-
58
-
59
-
60
-
61
-
62
-
63
-
64
-
65
-
66
-
 67
67 -
 68
68 -
 69
69 -
 70
70 -
 71
71 -
 72
72 -
 73
73 -
 74
74 -
 75
75 -
 76
76 -
 77
77 -
 78
78 -
 79
79 -
 80
80 -
 81
81 -
 82
82 -
 83
83 -
 84
84 -
 85
85 -
 86
86 -
 87
87 -
88
-
89
-
90
-
91
-
92
-
93
-
94
-
95
-
96
-
97
-
98
-
99
-
100
-
101
-
102
-
103
-
104
-
105
-
106
-
107
-
108
-
109
-
110
-
111
-
112
-
113
-
114
-
115
-
116
-
117
-
118
-
119
-
120
-
121
-
122
-
123
-
124
-
125
-
126
-
127
-
128
-
129
-
130
-
131
-
132
-
133
-
134
-
135
-
136
-
137
-
138
-
139
-
140
-
141
-
142
-
143
-
144
-
145
-
146
-
147
-
148
-
149
-
150
-
151
-
152
-
153
-
154
-
155
-
156
-
157
-
158
-
159
-
160
-
161
-
162
-
163
-
164
-
165
-
166
-
167
-
168
-
169
-
170
-
171
-
172
-
173
-
174
-
175
-
176
-
177
-
178
-
179
-
180
-
181
-
182
-
183
-
184
-
185
-
186
-
187
-
188
-
189
-
190
-
191
-
192
-
193
-
194
-
195
-
196
-
197
-
198
-
199
-
200
-
201
-
202
-
203
-
204
-
205
-
206
-
207
-
208
-
209
-
210
-
211
-
212
-
213
-
214
-
215
-
216
-
217
-
218
-
219
-
220
-
221
-
222
-
223
-
224
-
225
-
226
-
227
-
228
-
229
-
230
-
231
-
232
-
233
-
234
-
235
-
236
-
237
-
238
-
239
-
240
-
241
-
242
-
243
 |
 |
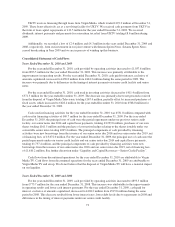
For the year ended December 31, 2009, cash used in investing activities increased to £571.3 million from
£467.1 million for the year ended December 31, 2008. The cash used in investing activities in the years ended
December 31, 2009 and 2008 mainly represented purchases of fixed assets. Purchases of fixed and intangible
assets increased to £568.0 million for the year ended December 31, 2009 from £476.3 million for the same period
in 2008, primarily due to lower use of finance leases for the acquisition of capital equipment together with
increased scaleable infrastructure costs relating to broadband speed upgrades.
Cash used in financing activities for the year ended December 31, 2009 was £69.7 million compared with
cash used in financing activities of £427.3 million for the year ended December 31, 2008. For the year ended
December 31, 2009, the principal uses of cash were the partial repayments under our senior credit facility and our
senior notes due 2014, and capital lease payments, totaling £1,737.4 million, and the principal components of
cash provided by financing activities were new borrowings from the issuance of our senior notes due 2016 and
our senior notes due 2019, net of financing fees, of £1,610.2 million. For the year ended December 31, 2008, the
principal uses of cash were the partial repayments under our senior credit facility and capital lease payments,
totaling £846.3 million, and the principal components of cash provided by financing activities were new
borrowings from the issuance of our convertible senior notes, net of financing fees, of £447.7 million. See further
discussion under “Liquidity and Capital Resources—Senior Credit Facility”.
Liquidity and Capital Resources
As of December 31, 2010, we had £6,020.4 million of debt outstanding, compared to £5,974.7 million as of
December 31, 2009, and £479.5 million of cash and cash equivalents, compared to £430.5 million as of
December 31, 2009. The increase in debt from December 31, 2009 is primarily due to movements in exchange
rates and, to a lesser extent, an increase in net borrowing.
Our business is capital intensive and has significant leverage. We have significant cash requirements for
operating costs, capital expenditures and interest expense. The level of our capital expenditures and operating
expenditures are affected by the significant amounts of capital required to connect customers to our network,
expand and upgrade our network and offer new services.
We expect that our cash on hand, together with cash from operations and amounts undrawn on our revolving
credit facility, will be sufficient for our cash requirements through December 31, 2011. However, our cash
requirements after December 31, 2011 may exceed these sources of cash. We partially refinanced our senior
credit facility and now have no significant principal payments under our senior credit facility until 2015.
We issued approximately £1.5 billion equivalent aggregate principal amount of senior secured notes on
January 19, 2010, in a private placement to qualified institutional buyers pursuant to Rule 144A under the
Securities Act, and outside the United States to certain non-U.S. persons pursuant to Regulation S under the
Securities Act. These notes were issued by our wholly owned subsidiary Virgin Media Secured Finance PLC in
two tranches: $1.0 billion of 6.50% senior secured notes due 2018 and £875 million of 7.00% senior secured
notes due 2018. For more information see “—Senior Secured Notes” below. The net proceeds from the issuance
of these notes were used to repay £1,453.0 million of our obligations under our old senior credit facility.
On April 19, 2010, we drew down an aggregate principal amount of £1,675.0 million under a new senior
facilities agreement dated March 16, 2010, as amended and restated, or the new senior credit facility, and applied
the proceeds towards the repayment in full of all amounts outstanding under our old senior credit facility and for
general corporate purposes. The new senior credit facility comprises a term loan A facility in an aggregate
principal amount of £1,000 million, a term loan B facility in an aggregate principal amount of £675 million and a
revolving credit facility in an aggregate principal amount of £250 million. For more information see “—Senior
Credit Facility” below.
74