Virgin Media 2010 Annual Report Download - page 105
Download and view the complete annual report
Please find page 105 of the 2010 Virgin Media annual report below. You can navigate through the pages in the report by either clicking on the pages listed below, or by using the keyword search tool below to find specific information within the annual report.-
 1
1 -
2
-
3
-
4
-
5
-
6
-
7
-
8
-
9
-
10
-
11
-
12
-
13
-
14
-
15
-
16
-
17
-
18
-
19
-
20
-
21
-
22
-
23
-
24
-
25
-
26
-
27
-
28
-
29
-
30
-
31
-
32
-
33
-
34
-
35
-
36
-
37
-
38
-
39
-
40
-
41
-
42
-
43
-
44
-
45
-
46
-
47
-
48
-
49
-
50
-
51
-
52
-
53
-
54
-
55
-
56
-
57
-
58
-
59
-
60
-
61
-
62
-
63
-
64
-
65
-
66
-
67
-
68
-
69
-
70
-
71
-
72
-
73
-
74
-
75
-
76
-
77
-
78
-
79
-
80
-
81
-
82
-
83
-
84
-
85
-
86
-
87
-
88
-
89
-
90
-
91
-
92
-
93
-
94
-
 95
95 -
 96
96 -
 97
97 -
 98
98 -
 99
99 -
 100
100 -
 101
101 -
 102
102 -
 103
103 -
 104
104 -
 105
105 -
 106
106 -
 107
107 -
 108
108 -
 109
109 -
 110
110 -
 111
111 -
 112
112 -
 113
113 -
 114
114 -
 115
115 -
116
-
117
-
118
-
119
-
120
-
121
-
122
-
123
-
124
-
125
-
126
-
127
-
128
-
129
-
130
-
131
-
132
-
133
-
134
-
135
-
136
-
137
-
138
-
139
-
140
-
141
-
142
-
143
-
144
-
145
-
146
-
147
-
148
-
149
-
150
-
151
-
152
-
153
-
154
-
155
-
156
-
157
-
158
-
159
-
160
-
161
-
162
-
163
-
164
-
165
-
166
-
167
-
168
-
169
-
170
-
171
-
172
-
173
-
174
-
175
-
176
-
177
-
178
-
179
-
180
-
181
-
182
-
183
-
184
-
185
-
186
-
187
-
188
-
189
-
190
-
191
-
192
-
193
-
194
-
195
-
196
-
197
-
198
-
199
-
200
-
201
-
202
-
203
-
204
-
205
-
206
-
207
-
208
-
209
-
210
-
211
-
212
-
213
-
214
-
215
-
216
-
217
-
218
-
219
-
220
-
221
-
222
-
223
-
224
-
225
-
226
-
227
-
228
-
229
-
230
-
231
-
232
-
233
-
234
-
235
-
236
-
237
-
238
-
239
-
240
-
241
-
242
-
243
 |
 |
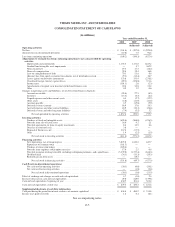
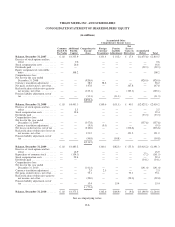
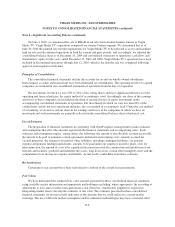
VIRGIN MEDIA INC. AND SUBSIDIARIES
NOTES TO CONSOLIDATED FINANCIAL STATEMENTS (continued)
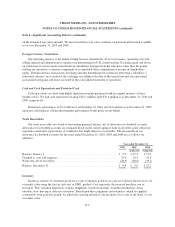
Note 2—Significant Accounting Policies (continued)
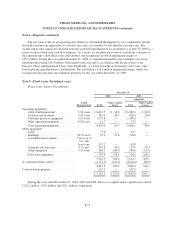
Fixed Assets
Depreciation is computed by the straight-line method over the estimated useful economic lives of the assets.
Land and fixed assets held for sale are not depreciated. Estimated useful economic lives are as follows:
Operating equipment:
Cable distribution plant ............... 5-30 years
Switches and headends ............... 3-10 years
Customer premises equipment .......... 5-10 years
Other operating equipment ............ 4-20 years
Other equipment:
Buildings .......................... 20-50 years
Leasehold improvements .............. 7years or, if less, the lease term
Computer infrastructure ............... 3-5years
Other equipment .................... 5-10 years
The cost of fixed assets includes amounts capitalized for labor and overhead expended in connection with
the design and installation of our operating network equipment and facilities. Costs associated with initial
customer installations, additions of network equipment necessary to enable enhanced services, acquisition of
additional fixed assets and replacement of existing fixed assets are capitalized. The costs of reconnecting the
same service to a previously installed premise are charged to expense in the period incurred. Costs for repairs and
maintenance are charged to expense as incurred.
Labor and overhead costs directly related to the construction and installation of fixed assets, including
payroll and related costs of some employees and related rent and other occupancy costs, are capitalized. The
payroll and related costs of some employees that are directly related to construction and installation activities are
capitalized based on specific time devoted to these activities where identifiable. In cases where the time devoted
to these activities is not specifically identifiable, we capitalize costs based upon estimated allocations.
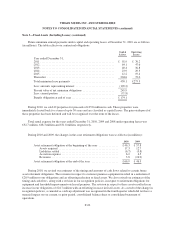
Software Development Costs
We capitalize costs related to computer software developed or obtained for internal use in accordance with
the Intangibles—Goodwill and Other Topic of the FASB ASC. Software obtained for internal use has generally
been enterprise-level business and finance software that we customize to meet our specific operational needs.
Costs incurred in the application development phase are capitalized and amortized over their useful lives, which
are generally three to five years. We have not sold, leased or licensed software developed for internal use to our
customers and we have no intention of doing so in the future.
Goodwill and Intangible Assets
Goodwill and other intangible assets with indefinite lives, such as reorganization value in excess of amount
allocable to identifiable assets, are not amortized and are tested for impairment annually or more frequently if
circumstances indicate a possible impairment exists in accordance with the Intangibles—Goodwill and Other
Topic of the Financial Accounting Standards Board (“FASB”) Accounting Standards Codification (“ASC”).
Intangible assets include customer lists. Customer lists represent the portion of the purchase price allocated
to the value of the customer base acquired in business combinations. Customer lists are amortized on a straight-
line basis over the period in which we expect to derive benefits, which is principally three to six years.
F-10