Virgin Media 2010 Annual Report Download - page 208
Download and view the complete annual report
Please find page 208 of the 2010 Virgin Media annual report below. You can navigate through the pages in the report by either clicking on the pages listed below, or by using the keyword search tool below to find specific information within the annual report.-
 1
1 -
2
-
3
-
4
-
5
-
6
-
7
-
8
-
9
-
10
-
11
-
12
-
13
-
14
-
15
-
16
-
17
-
18
-
19
-
20
-
21
-
22
-
23
-
24
-
25
-
26
-
27
-
28
-
29
-
30
-
31
-
32
-
33
-
34
-
35
-
36
-
37
-
38
-
39
-
40
-
41
-
42
-
43
-
44
-
45
-
46
-
47
-
48
-
49
-
50
-
51
-
52
-
53
-
54
-
55
-
56
-
57
-
58
-
59
-
60
-
61
-
62
-
63
-
64
-
65
-
66
-
67
-
68
-
69
-
70
-
71
-
72
-
73
-
74
-
75
-
76
-
77
-
78
-
79
-
80
-
81
-
82
-
83
-
84
-
85
-
86
-
87
-
88
-
89
-
90
-
91
-
92
-
93
-
94
-
95
-
96
-
97
-
98
-
99
-
100
-
101
-
102
-
103
-
104
-
105
-
106
-
107
-
108
-
109
-
110
-
111
-
112
-
113
-
114
-
115
-
116
-
117
-
118
-
119
-
120
-
121
-
122
-
123
-
124
-
125
-
126
-
127
-
128
-
129
-
130
-
131
-
132
-
133
-
134
-
135
-
136
-
137
-
138
-
139
-
140
-
141
-
142
-
143
-
144
-
145
-
146
-
147
-
148
-
149
-
150
-
151
-
152
-
153
-
154
-
155
-
156
-
157
-
158
-
159
-
160
-
161
-
162
-
163
-
164
-
165
-
166
-
167
-
168
-
169
-
170
-
171
-
172
-
173
-
174
-
175
-
176
-
177
-
178
-
179
-
180
-
181
-
182
-
183
-
184
-
185
-
186
-
187
-
188
-
189
-
190
-
191
-
192
-
193
-
194
-
195
-
196
-
197
-
 198
198 -
 199
199 -
 200
200 -
 201
201 -
 202
202 -
 203
203 -
 204
204 -
 205
205 -
 206
206 -
 207
207 -
 208
208 -
 209
209 -
 210
210 -
 211
211 -
 212
212 -
 213
213 -
 214
214 -
 215
215 -
 216
216 -
 217
217 -
 218
218 -
219
-
220
-
221
-
222
-
223
-
224
-
225
-
226
-
227
-
228
-
229
-
230
-
231
-
232
-
233
-
234
-
235
-
236
-
237
-
238
-
239
-
240
-
241
-
242
-
243
 |
 |

VIRGIN MEDIA INVESTMENT HOLDINGS LIMITED AND SUBSIDIARIES
VIRGIN MEDIA INVESTMENTS LIMITED AND SUBSIDIARIES
COMBINED NOTES TO THE CONSOLIDATED FINANCIAL STATEMENTS (continued)
Note 9—Fair Value Measurements (continued)
transactions in either the listed or over-the counter markets, adjusted for non-performance risk. As such, these
derivative instruments are classified within level 2 in the fair value hierarchy. The carrying amounts of our
derivative financial instruments are disclosed in note 10.
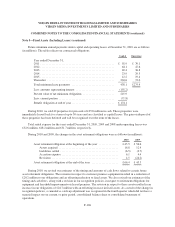
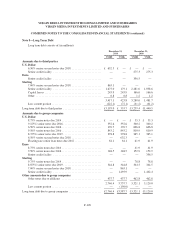
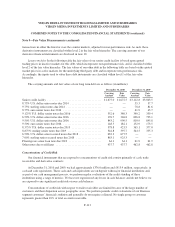
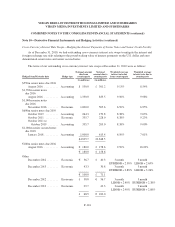
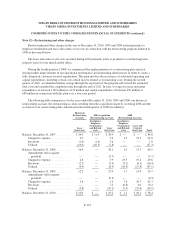
Long term debt: In the following table the fair value of our senior credit facility is based upon quoted
trading prices in inactive markets for this debt, which incorporates non-performance risk, and is classified within
level 2 of the fair value hierarchy. The fair values of our other debt in the following table are based on the quoted
market prices in active markets for the underlying third party debt and incorporate non-performance risk.
Accordingly, the inputs used to value these debt instruments are classified within level 1 of the fair value
hierarchy.
The carrying amounts and fair values of our long term debt are as follows (in millions):
December 31, 2010 December 31, 2009
Carrying
Amount
Fair
Value
Carrying
Amount
Fair
Value
Senior credit facility ...................................... £1,675.0 £1,672.5 £3,112.8 £3,043.5
8.75% U.S. dollar senior notes due 2014 ...................... — — 55.3 57.7
9.75% sterling senior notes due 2014 ......................... — — 78.8 81.6
8.75% euro senior notes due 2014 ........................... — — 41.9 43.7
9.125% U.S. dollar senior notes due 2016 ..................... 352.6 380.3 340.2 359.4
6.50% U.S. dollar senior notes due 2016 ...................... 176.7 346.8 606.8 723.1
9.50% U.S. dollar senior notes due 2016 ...................... 843.2 990.5 810.9 895.8
9.50% euro senior notes due 2016 ........................... 148.5 182.1 152.9 173.5
8.375% U.S. dollar senior notes due 2019 ..................... 378.8 421.5 365.1 377.0
8.875% sterling senior notes due 2019 ........................ 344.8 397.7 344.5 355.3
6.50% U.S. dollar senior secured notes due 2018 ................ 632.3 677.5 — —
7.00% sterling senior secured notes due 2018 .................. 863.1 925.3 — —
Floating rate senior loan note due 2012 ....................... 64.1 64.1 61.9 61.9
Other notes due to affiliates ................................ 437.7 437.7 462.8 462.8
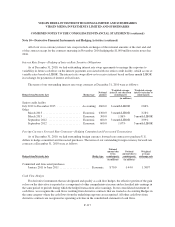
Concentrations of Credit Risk
Our financial instruments that are exposed to concentrations of credit risk consist primarily of cash, trade
receivables and derivative contracts.
At December 31, 2010 and 2009, we had approximately £376.0 million and £415.9 million, respectively, in
cash and cash equivalents. These cash and cash equivalents are on deposit with major financial institutions and,
as part of our cash management process, we perform regular evaluations of the credit standing of these
institutions using a range of metrics. We have not experienced any losses in cash balances and do not believe we
are exposed to any significant credit risk on our cash balances.
Concentrations of credit risk with respect to trade receivables are limited because of the large number of
customers and their dispersion across geographic areas. We perform periodic credit evaluations of our Business
segment customers’ financial condition and generally do not require collateral. No single group or customer
represents greater than 10% of total accounts receivable.
F-113