Virgin Media 2010 Annual Report Download - page 47
Download and view the complete annual report
Please find page 47 of the 2010 Virgin Media annual report below. You can navigate through the pages in the report by either clicking on the pages listed below, or by using the keyword search tool below to find specific information within the annual report.-
 1
1 -
2
-
3
-
4
-
5
-
6
-
7
-
8
-
9
-
10
-
11
-
12
-
13
-
14
-
15
-
16
-
17
-
18
-
19
-
20
-
21
-
22
-
23
-
24
-
25
-
26
-
27
-
28
-
29
-
30
-
31
-
32
-
33
-
34
-
35
-
36
-
 37
37 -
 38
38 -
 39
39 -
 40
40 -
 41
41 -
 42
42 -
 43
43 -
 44
44 -
 45
45 -
 46
46 -
 47
47 -
 48
48 -
 49
49 -
 50
50 -
 51
51 -
 52
52 -
 53
53 -
 54
54 -
 55
55 -
 56
56 -
 57
57 -
58
-
59
-
60
-
61
-
62
-
63
-
64
-
65
-
66
-
67
-
68
-
69
-
70
-
71
-
72
-
73
-
74
-
75
-
76
-
77
-
78
-
79
-
80
-
81
-
82
-
83
-
84
-
85
-
86
-
87
-
88
-
89
-
90
-
91
-
92
-
93
-
94
-
95
-
96
-
97
-
98
-
99
-
100
-
101
-
102
-
103
-
104
-
105
-
106
-
107
-
108
-
109
-
110
-
111
-
112
-
113
-
114
-
115
-
116
-
117
-
118
-
119
-
120
-
121
-
122
-
123
-
124
-
125
-
126
-
127
-
128
-
129
-
130
-
131
-
132
-
133
-
134
-
135
-
136
-
137
-
138
-
139
-
140
-
141
-
142
-
143
-
144
-
145
-
146
-
147
-
148
-
149
-
150
-
151
-
152
-
153
-
154
-
155
-
156
-
157
-
158
-
159
-
160
-
161
-
162
-
163
-
164
-
165
-
166
-
167
-
168
-
169
-
170
-
171
-
172
-
173
-
174
-
175
-
176
-
177
-
178
-
179
-
180
-
181
-
182
-
183
-
184
-
185
-
186
-
187
-
188
-
189
-
190
-
191
-
192
-
193
-
194
-
195
-
196
-
197
-
198
-
199
-
200
-
201
-
202
-
203
-
204
-
205
-
206
-
207
-
208
-
209
-
210
-
211
-
212
-
213
-
214
-
215
-
216
-
217
-
218
-
219
-
220
-
221
-
222
-
223
-
224
-
225
-
226
-
227
-
228
-
229
-
230
-
231
-
232
-
233
-
234
-
235
-
236
-
237
-
238
-
239
-
240
-
241
-
242
-
243
 |
 |

an aggregate purchase price of $61.7 million (or £39.0 million). The shares of common stock acquired in
connection with these programs have been cancelled. The remaining amount authorized under this plan is
£213.5 million ($333.0 million based on the exchange rate as at December 31, 2010).
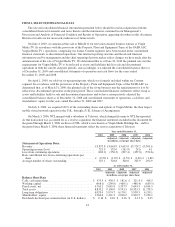
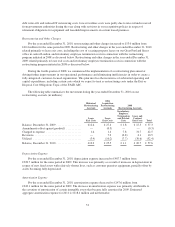
Revenue
Our revenue by segment for the years ended December 31, 2010, 2009 and 2008 was as follows
(in millions):
Year ended December 31,
2010 2009 2008
Consumer ................................ £3,279.0 84.6% £3,083.1 84.1% £3,029.0 82.9%
Business ................................. 596.8 15.4 580.8 15.9 626.0 17.1
£3,875.8 100.0% £3,663.9 100.0% £3,655.0 100.0%
The principal sources of revenue within each segment are:
Consumer
• monthly fees and usage charges for cable and non-cable telephone and internet access services and
cable television services;
• monthly fees and usage charges for mobile services including charges for airtime, data, long-distance
calls and roaming; and
• charges for the supply of mobile handset and other equipment.
Business
• monthly fees and usage charges for inbound and outbound voice, data and internet services and charges
for transmission, fiber and voice services provided to retail and wholesale customers.
Expenses
The principal components of our operating costs and selling, general and administrative expenses within
each segment include:
Consumer
• payroll and other employee-related costs including outsourcing;
• television programming services and programming costs;
• interconnect costs paid to carriers relating to call termination services;
• marketing and selling costs; and
• purchase costs of mobile handsets and other equipment.
Business
• payroll and other employee-related costs;
• interconnect and circuit costs paid to other telecommunication carriers; and
• marketing and selling costs.
44