Virgin Media 2010 Annual Report Download - page 56
Download and view the complete annual report
Please find page 56 of the 2010 Virgin Media annual report below. You can navigate through the pages in the report by either clicking on the pages listed below, or by using the keyword search tool below to find specific information within the annual report.-
 1
1 -
2
-
3
-
4
-
5
-
6
-
7
-
8
-
9
-
10
-
11
-
12
-
13
-
14
-
15
-
16
-
17
-
18
-
19
-
20
-
21
-
22
-
23
-
24
-
25
-
26
-
27
-
28
-
29
-
30
-
31
-
32
-
33
-
34
-
35
-
36
-
37
-
38
-
39
-
40
-
41
-
42
-
43
-
44
-
45
-
 46
46 -
 47
47 -
 48
48 -
 49
49 -
 50
50 -
 51
51 -
 52
52 -
 53
53 -
 54
54 -
 55
55 -
 56
56 -
 57
57 -
 58
58 -
 59
59 -
 60
60 -
 61
61 -
 62
62 -
 63
63 -
 64
64 -
 65
65 -
 66
66 -
67
-
68
-
69
-
70
-
71
-
72
-
73
-
74
-
75
-
76
-
77
-
78
-
79
-
80
-
81
-
82
-
83
-
84
-
85
-
86
-
87
-
88
-
89
-
90
-
91
-
92
-
93
-
94
-
95
-
96
-
97
-
98
-
99
-
100
-
101
-
102
-
103
-
104
-
105
-
106
-
107
-
108
-
109
-
110
-
111
-
112
-
113
-
114
-
115
-
116
-
117
-
118
-
119
-
120
-
121
-
122
-
123
-
124
-
125
-
126
-
127
-
128
-
129
-
130
-
131
-
132
-
133
-
134
-
135
-
136
-
137
-
138
-
139
-
140
-
141
-
142
-
143
-
144
-
145
-
146
-
147
-
148
-
149
-
150
-
151
-
152
-
153
-
154
-
155
-
156
-
157
-
158
-
159
-
160
-
161
-
162
-
163
-
164
-
165
-
166
-
167
-
168
-
169
-
170
-
171
-
172
-
173
-
174
-
175
-
176
-
177
-
178
-
179
-
180
-
181
-
182
-
183
-
184
-
185
-
186
-
187
-
188
-
189
-
190
-
191
-
192
-
193
-
194
-
195
-
196
-
197
-
198
-
199
-
200
-
201
-
202
-
203
-
204
-
205
-
206
-
207
-
208
-
209
-
210
-
211
-
212
-
213
-
214
-
215
-
216
-
217
-
218
-
219
-
220
-
221
-
222
-
223
-
224
-
225
-
226
-
227
-
228
-
229
-
230
-
231
-
232
-
233
-
234
-
235
-
236
-
237
-
238
-
239
-
240
-
241
-
242
-
243
 |
 |

debt write-offs and reduced IT outsourcing costs. Lower facilities costs were partly due to rates refunds received
from government authorities during the year along with revisions in our recognition policies in respect of
retirement obligations for equipment and leasehold improvements on certain leased premises.
Restructuring and Other Charges
For the year ended December 31, 2010, restructuring and other charges increased to £53.0 million from
£40.4 million for the same period in 2009. Restructuring and other charges in the year ended December 31, 2010
related primarily to lease exit costs, including the cost of vacating property leases on our Great Portland Street
office in central London, and involuntary employee termination costs in connection with the restructuring
program initiated in 2008 as discussed below. Restructuring and other charges in the year ended December 31,
2009 related primarily to lease exit costs and involuntary employee termination costs in connection with the
restructuring program initiated in 2008 as discussed below.
During the fourth quarter of 2008, we commenced the implementation of a restructuring plan aimed at
driving further improvements in our operational performance and eliminating inefficiencies in order to create a
fully-integrated, customer-focused organization. This plan involves the incurrence of substantial operating and
capital expenditures, including certain costs which we expect to treat as restructuring costs under the Exit or
Disposal Cost Obligations Topic of the FASB ASC.
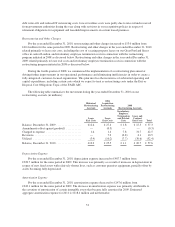
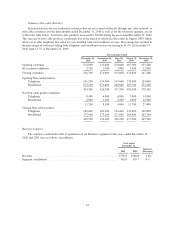
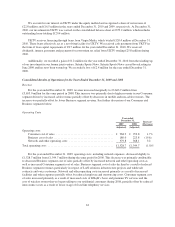
The following table summarizes the movement during the year ended December 31, 2010 on our
restructuring accruals (in millions):
Historical
Restructuring
Accruals
2006
Acquisition
Restructuring
Accruals
2008
Restructuring Accruals
Total
Lease
Exit Costs
Lease
Exit Costs
Involuntary
Employee
Termination
and Related
Costs
Lease and
Contract
Exit Costs
Balance, December 31, 2009 .................. £12.6 £ 27.4 £ 1.8 £ 15.5 £ 57.3
Amendments offset against goodwill ........... — (0.3) — — (0.3)
Charged to expense ......................... 1.6 1.4 7.8 31.7 42.5
Revisions ................................. — 7.2 (0.8) 4.1 10.5
Utilized .................................. (3.9) (10.2) (7.7) (30.6) (52.4)
Balance, December 31, 2010 .................. £10.3 £ 25.5 £ 1.1 £ 20.7 £ 57.6
Depreciation Expense
For the year ended December 31, 2010, depreciation expense increased to £987.7 million from
£928.7 million for the same period in 2009. This increase was primarily as a result of increases in depreciation in
respect of new fixed assets with relatively shorter lives, such as customer premises equipment, partially offset by
assets becoming fully depreciated.
Amortization Expense
For the year ended December 31, 2010, amortization expense decreased to £147.6 million from
£243.1 million for the same period in 2009. The decrease in amortization expense was primarily attributable to
the cessation of amortization of certain intangible assets that became fully amortized in 2009. Estimated
aggregate amortization expense for 2011 is £118.4 million and nil thereafter.
53