US Airways 2003 Annual Report Download - page 97
Download and view the complete annual report
Please find page 97 of the 2003 US Airways annual report below. You can navigate through the pages in the report by either clicking on the pages listed below, or by using the keyword search tool below to find specific information within the annual report.-
 1
1 -
2
-
3
-
4
-
5
-
6
-
7
-
8
-
9
-
10
-
11
-
12
-
13
-
14
-
15
-
16
-
17
-
18
-
19
-
20
-
21
-
22
-
23
-
24
-
25
-
26
-
27
-
28
-
29
-
30
-
31
-
32
-
33
-
34
-
35
-
36
-
37
-
38
-
39
-
40
-
41
-
42
-
43
-
44
-
45
-
46
-
47
-
48
-
49
-
50
-
51
-
52
-
53
-
54
-
55
-
56
-
57
-
58
-
59
-
60
-
61
-
62
-
63
-
64
-
65
-
66
-
67
-
68
-
69
-
70
-
71
-
72
-
73
-
74
-
75
-
76
-
77
-
78
-
79
-
80
-
81
-
82
-
83
-
84
-
85
-
86
-
 87
87 -
 88
88 -
 89
89 -
 90
90 -
 91
91 -
 92
92 -
 93
93 -
 94
94 -
 95
95 -
 96
96 -
 97
97 -
 98
98 -
 99
99 -
 100
100 -
 101
101 -
 102
102 -
 103
103 -
 104
104 -
 105
105 -
 106
106 -
 107
107 -
108
-
109
-
110
-
111
-
112
-
113
-
114
-
115
-
116
-
117
-
118
-
119
-
120
-
121
-
122
-
123
-
124
-
125
-
126
-
127
-
128
-
129
-
130
-
131
-
132
-
133
-
134
-
135
-
136
-
137
-
138
-
139
-
140
-
141
-
142
-
143
-
144
-
145
-
146
-
147
-
148
-
149
-
150
-
151
-
152
-
153
-
154
-
155
-
156
-
157
-
158
-
159
-
160
-
161
-
162
-
163
-
164
-
165
-
166
-
167
-
168
-
169
-
170
-
171
-
172
-
173
-
174
-
175
-
176
-
177
-
178
-
179
-
180
-
181
-
182
-
183
-
184
-
185
-
186
-
187
-
188
-
189
-
190
-
191
-
192
-
193
-
194
-
195
-
196
-
197
-
198
-
199
-
200
-
201
-
202
-
203
-
204
-
205
-
206
-
207
-
208
-
209
-
210
-
211
-
212
-
213
-
214
-
215
-
216
-
217
-
218
-
219
-
220
-
221
-
222
-
223
-
224
-
225
-
226
-
227
-
228
-
229
-
230
-
231
-
232
-
233
-
234
-
235
-
236
-
237
 |
 |

Table of Contents
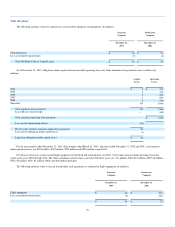
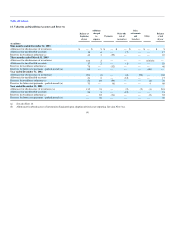
The activity within Other comprehensive income (loss) and the related income tax effects are as follows (in millions):
Successor
Company
Predecessor Company
Nine Months
Ended
December 31,
2003
Three Months
Ended
March 31,
2003
Year Ended
December 31,
2002
2001
Unrealized loss on available-for-sale securities $ — $ — $ (2) $ —
Fuel cash flow hedges: — — — —
SFAS 133 transition adjustment, net of tax of $(1) in 2001 — — — 1
Reclassification adjustment for gains included in net income (loss) during the period, net of tax of $1 in 2001 (14) (16) (13) —
Change in fair value of hedges 45 5 40 (18)
Unrealized gain (loss), net of reclassification adjustment 31 (11) 27 (17)
Minimum pension liability adjustment (86) 85 (742) (138)
Adjustments in connection with reorganization — 796 — —
Other comprehensive income (loss) $ (55) $ 870 $(717) $(155)
There was no tax effect on any element of Other comprehensive income during the nine months ended December 31, 2003, three months ended March
31, 2003, and year ended December 31, 2002.
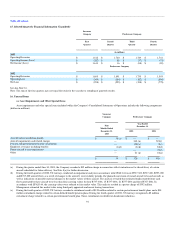
12. Operating Segments and Related Disclosures
The Company is managed as a single business unit that provides air transportation for passengers and cargo. This allows it to benefit from an integrated
revenue pricing and route network that includes US Airways, Piedmont, Allegheny, PSA and third-party carriers that fly under capacity purchase agreements
as part of US Airways Express. The flight equipment of all these carriers is combined to form one fleet which is deployed through a single route scheduling
system. When making resource allocation decisions, the chief operating decision maker evaluates flight profitability data, which considers aircraft type and
route economics, but gives no weight to the financial impact of the resource allocation decision on an individual carrier basis. The objective in making
resource allocation decisions is to maximize consolidated financial results, not the individual results of US Airways, Piedmont, Allegheny and PSA.
Information concerning operating revenues (based on revenue passenger miles and yield) in principal geographic areas is as follows (in millions):
Successor
Company
Predecessor Company
Nine Months
Ended
December 31,
2003
Three Months
Ended
March 31,
2003
Year Ended
December 31,
2002
2001
United States $ 4,456 $ 1,314 $ 6,003 $ 7,414
Foreign 794 198 912 839
$ 5,250 $ 1,512 $ 6,915 $ 8,253
87