US Airways 2003 Annual Report Download - page 96
Download and view the complete annual report
Please find page 96 of the 2003 US Airways annual report below. You can navigate through the pages in the report by either clicking on the pages listed below, or by using the keyword search tool below to find specific information within the annual report.-
 1
1 -
2
-
3
-
4
-
5
-
6
-
7
-
8
-
9
-
10
-
11
-
12
-
13
-
14
-
15
-
16
-
17
-
18
-
19
-
20
-
21
-
22
-
23
-
24
-
25
-
26
-
27
-
28
-
29
-
30
-
31
-
32
-
33
-
34
-
35
-
36
-
37
-
38
-
39
-
40
-
41
-
42
-
43
-
44
-
45
-
46
-
47
-
48
-
49
-
50
-
51
-
52
-
53
-
54
-
55
-
56
-
57
-
58
-
59
-
60
-
61
-
62
-
63
-
64
-
65
-
66
-
67
-
68
-
69
-
70
-
71
-
72
-
73
-
74
-
75
-
76
-
77
-
78
-
79
-
80
-
81
-
82
-
83
-
84
-
85
-
 86
86 -
 87
87 -
 88
88 -
 89
89 -
 90
90 -
 91
91 -
 92
92 -
 93
93 -
 94
94 -
 95
95 -
 96
96 -
 97
97 -
 98
98 -
 99
99 -
 100
100 -
 101
101 -
 102
102 -
 103
103 -
 104
104 -
 105
105 -
 106
106 -
107
-
108
-
109
-
110
-
111
-
112
-
113
-
114
-
115
-
116
-
117
-
118
-
119
-
120
-
121
-
122
-
123
-
124
-
125
-
126
-
127
-
128
-
129
-
130
-
131
-
132
-
133
-
134
-
135
-
136
-
137
-
138
-
139
-
140
-
141
-
142
-
143
-
144
-
145
-
146
-
147
-
148
-
149
-
150
-
151
-
152
-
153
-
154
-
155
-
156
-
157
-
158
-
159
-
160
-
161
-
162
-
163
-
164
-
165
-
166
-
167
-
168
-
169
-
170
-
171
-
172
-
173
-
174
-
175
-
176
-
177
-
178
-
179
-
180
-
181
-
182
-
183
-
184
-
185
-
186
-
187
-
188
-
189
-
190
-
191
-
192
-
193
-
194
-
195
-
196
-
197
-
198
-
199
-
200
-
201
-
202
-
203
-
204
-
205
-
206
-
207
-
208
-
209
-
210
-
211
-
212
-
213
-
214
-
215
-
216
-
217
-
218
-
219
-
220
-
221
-
222
-
223
-
224
-
225
-
226
-
227
-
228
-
229
-
230
-
231
-
232
-
233
-
234
-
235
-
236
-
237
 |
 |

Table of Contents
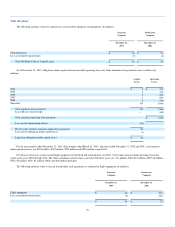
US Airways recognized expenses related to Stock Grants of $1 million, $3 million and $9 million for the three months ended March 31, 2003 and years
ended December 31, 2002 and 2001, respectively, and expenses related to Option Grants of $1 million in 2001. Deferred compensation related to Stock
Grants was $5 million as of December 31, 2002.
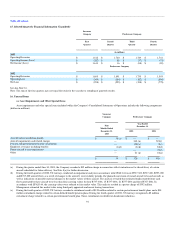
The weighted average fair value per stock option for stock options which had an exercise price equal to the fair market value of a share of US Airways
Group common stock at date of grant was $3 for 2002 and 2001. There were no such grants in the three months ended March 31, 2003. The weighted average
fair value per stock option for stock options which had an exercise price greater than the fair market value of a share of US Airways Group common stock was
$3 for 2002. There were no such grants in the three months ended March 31, 2003 or year ended December 31, 2001. The weighted average fair value per
stock option for stock options which had an exercise price lower than the fair market value of US Airways Group common stock was $21 for 2001. There
were no such grants during the three months ended March 31, 2003 or the year ended December 31, 2002.
11. Accumulated other comprehensive income (loss), net of income tax effect
Statement of Financial Accounting Standards No. 130, "Reporting Comprehensive Income" establishes standards for the reporting and presentation of
comprehensive income and its components in financial statements. Comprehensive income encompasses net income and "other comprehensive income,"
which includes all other non-owner transactions and events that change stockholder's equity. US Airways' other comprehensive income includes unrealized
gains (losses) on available-for-sale securities, certain changes in the fair value of certain derivative instruments and an adjustment for minimum pension
liability, each shown net of income tax effects.
Unrealized gains (losses) on available-for-sale securities are accounted for in accordance with SFAS 115. US Airways records an adjustment to
Stockholder's Equity (Deficit) to reflect differences between the fair value of its short-term investments (considered "available-for-sale" under SFAS 115) and
carrying value at each balance sheet date. In accordance with SFAS 133, US Airways adjusts its balance sheet to reflect the current fair market value of its
fuel hedge contracts. The related gains or losses on these contracts are deferred in accumulated other comprehensive income unless they are considered
"ineffective" until the hedged fuel is recognized into earnings. In accordance with SFAS 87, US Airways recorded an adjustment for minimum pension
liability as of December 31, 2003, 2002 and 2001. SFAS 87 requires the recognition of an additional minimum pension liability for each defined benefit plan
for which the accumulated benefit obligation exceeds the fair value of the plan's assets and accrued pension costs. An offsetting intangible asset is recognized
for each additional minimum pension liability recorded. Because each intangible asset recognized is limited to the amount of unrecognized prior service cost,
any balance is reflected as a reduction of Stockholder's Equity (Deficit).
As presented in the accompanying Consolidated Statements of Stockholder's Equity (Deficit), US Airways recognized a comprehensive loss of $215
million including a net loss of $160 million and other comprehensive loss of $55 million for the nine months ended December 31, 2003. US Airways
recognized comprehensive income of $2.48 billion, including net income of $1.61 billion and other comprehensive income of $870 million for the three
months ended March 31, 2003. For the year ended December 31, 2002, US Airways recognized a comprehensive loss of $2.38 billion, including a net loss of
$1.66 billion and other comprehensive loss of $717 million. For the year ended December 31, 2001, US Airways recognized comprehensive loss of $2.14
billion, including a net loss of $1.99 billion and other comprehensive loss of $155 million.
86