US Airways 2003 Annual Report Download - page 31
Download and view the complete annual report
Please find page 31 of the 2003 US Airways annual report below. You can navigate through the pages in the report by either clicking on the pages listed below, or by using the keyword search tool below to find specific information within the annual report.-
 1
1 -
2
-
3
-
4
-
5
-
6
-
7
-
8
-
9
-
10
-
11
-
12
-
13
-
14
-
15
-
16
-
17
-
18
-
19
-
20
-
 21
21 -
 22
22 -
 23
23 -
 24
24 -
 25
25 -
 26
26 -
 27
27 -
 28
28 -
 29
29 -
 30
30 -
 31
31 -
 32
32 -
 33
33 -
 34
34 -
 35
35 -
 36
36 -
 37
37 -
 38
38 -
 39
39 -
 40
40 -
 41
41 -
42
-
43
-
44
-
45
-
46
-
47
-
48
-
49
-
50
-
51
-
52
-
53
-
54
-
55
-
56
-
57
-
58
-
59
-
60
-
61
-
62
-
63
-
64
-
65
-
66
-
67
-
68
-
69
-
70
-
71
-
72
-
73
-
74
-
75
-
76
-
77
-
78
-
79
-
80
-
81
-
82
-
83
-
84
-
85
-
86
-
87
-
88
-
89
-
90
-
91
-
92
-
93
-
94
-
95
-
96
-
97
-
98
-
99
-
100
-
101
-
102
-
103
-
104
-
105
-
106
-
107
-
108
-
109
-
110
-
111
-
112
-
113
-
114
-
115
-
116
-
117
-
118
-
119
-
120
-
121
-
122
-
123
-
124
-
125
-
126
-
127
-
128
-
129
-
130
-
131
-
132
-
133
-
134
-
135
-
136
-
137
-
138
-
139
-
140
-
141
-
142
-
143
-
144
-
145
-
146
-
147
-
148
-
149
-
150
-
151
-
152
-
153
-
154
-
155
-
156
-
157
-
158
-
159
-
160
-
161
-
162
-
163
-
164
-
165
-
166
-
167
-
168
-
169
-
170
-
171
-
172
-
173
-
174
-
175
-
176
-
177
-
178
-
179
-
180
-
181
-
182
-
183
-
184
-
185
-
186
-
187
-
188
-
189
-
190
-
191
-
192
-
193
-
194
-
195
-
196
-
197
-
198
-
199
-
200
-
201
-
202
-
203
-
204
-
205
-
206
-
207
-
208
-
209
-
210
-
211
-
212
-
213
-
214
-
215
-
216
-
217
-
218
-
219
-
220
-
221
-
222
-
223
-
224
-
225
-
226
-
227
-
228
-
229
-
230
-
231
-
232
-
233
-
234
-
235
-
236
-
237
 |
 |

Table of Contents
against its net deferred tax asset which resulted in a 2002 effective tax rate of 13%.
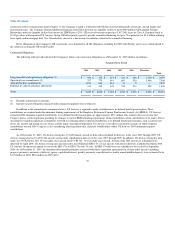
Selected Operating and Financial Statistics–System capacity (as measured by ASMs) decreased 6.9% and passenger volume (as measured by RPMs)
decreased 4.4% in 2003. These decreases resulted in a 71.5% system passenger load factor, representing a 1.9 percentage point increase over 2002. System
yield improved 2.1% reflecting a modest improvement in economic conditions. Both RPMs and ASMs were significantly affected by the schedule reductions
initiated following the Company's Chapter 11 filing. In addition, hurricanes Isabel, Fabian and Henri adversely impacted the Company's operating and
financial performance in 2003. US Airways full-time equivalent employees at December 31, 2003 declined 12.4% reflecting the headcount reduction
measures put in place in connection with the Company's 2002 restructuring.
2002 Compared With 2001
Operating Revenues– Operating revenues decreased $1.34 billion, or 16.2%. Passenger transportation revenues decreased $1.26 billion or 16.7%. RPMs
declined 10.9% which decreased revenues by $822 million combined with a 6.5% decrease in yield which decreased revenues by $433 million. The
unfavorable yield variances reflect a decline in business traffic as many companies imposed corporate travel restrictions due to the further weakening of the
general economy, particularly after September 11th. In addition, the airline industry engaged in heavy price discounting to stimulate the industry-wide soft
demand related to the sluggish economic conditions as well as the threat of war in Iraq and further terrorist attacks. The decrease in RPMs is due to the
schedule reductions that were initiated after September 11th and again after the Company's bankruptcy filing in August 2002. Cargo and freight revenues
decreased 14.5% primarily as a result of lower mail revenues, which reflect mail carriage restrictions imposed by the Federal Aviation Administration in the
aftermath of September 11th. Other operating revenue decreased due to lower mileage credit sales and revenues related to lease of surplus aircraft.
Operating Expenses–Operating expenses declined $1.64 billion, or 16.6%. Excluding Government compensation and Asset impairments and other special
items the Company's operating expenses were lower by 14.2% on a capacity decrease of 13.1%. The Company's Personnel costs decreased 14.4% due to
lower headcount levels and wage rate and salary reductions relating to the Company's reorganization. This was partially offset by increases in employee
pension and benefit expenses. Aviation fuel decreased 30.6% due to lower average fuel prices and schedule-driven decreases in consumption. US Airways
Express capacity purchases increased 20.5% reflecting an 19.1% increase in purchased ASMs from third-party regional jet operators and other airline
subsidiaries of US Airways Group. Aircraft rent decreased 8.4% due to the reduction in the number of leased aircraft that were operated. Other rent and
landing fees decreased 6.8% due to schedule-driven reductions in landings partially offset by higher landing fee rates. Aircraft maintenance decreased 33.2%
reflecting the retirement of older aircraft as well as the closure of the US Airways engine shop in Pittsburgh, PA in the fourth quarter of 2001. Selling
expenses decreased 32.5% due to elimination of the base domestic commissions in March 2002 and increases in internet bookings which are less costly to the
Company and generally lower maximum payments to travel agents implemented in August 2001 as well as sales volume driven decreases in credit card fees
and computer reservation service fees. Depreciation and amortization decreased 26.1% due to the retirement of the F100, B737-200, MD80 and DC9 aircraft
fleets partially offset by the purchase of new Airbus aircraft. In addition, the Company ceased amortizing its goodwill effective January 1, 2002 in connection
with its adoption of Statement of Financial Accounting Standards No. 142, "Goodwill and Other Intangible Assets" (SFAS 142). This favorably impacted
expenses by $19 million. Other operating expenses decreased 11.6% due to decreases in schedule-related expenses including passenger food expenses, crew
travel expenses and interrupted trip expenses. These decreases were partially offset by higher insurance expenses and higher security expenses. Refer to
"Description of Unusual Items" below for information on Asset impairments and other
26