US Airways 2003 Annual Report Download - page 101
Download and view the complete annual report
Please find page 101 of the 2003 US Airways annual report below. You can navigate through the pages in the report by either clicking on the pages listed below, or by using the keyword search tool below to find specific information within the annual report.-
 1
1 -
2
-
3
-
4
-
5
-
6
-
7
-
8
-
9
-
10
-
11
-
12
-
13
-
14
-
15
-
16
-
17
-
18
-
19
-
20
-
21
-
22
-
23
-
24
-
25
-
26
-
27
-
28
-
29
-
30
-
31
-
32
-
33
-
34
-
35
-
36
-
37
-
38
-
39
-
40
-
41
-
42
-
43
-
44
-
45
-
46
-
47
-
48
-
49
-
50
-
51
-
52
-
53
-
54
-
55
-
56
-
57
-
58
-
59
-
60
-
61
-
62
-
63
-
64
-
65
-
66
-
67
-
68
-
69
-
70
-
71
-
72
-
73
-
74
-
75
-
76
-
77
-
78
-
79
-
80
-
81
-
82
-
83
-
84
-
85
-
86
-
87
-
88
-
89
-
90
-
 91
91 -
 92
92 -
 93
93 -
 94
94 -
 95
95 -
 96
96 -
 97
97 -
 98
98 -
 99
99 -
 100
100 -
 101
101 -
 102
102 -
 103
103 -
 104
104 -
 105
105 -
 106
106 -
 107
107 -
 108
108 -
 109
109 -
 110
110 -
 111
111 -
112
-
113
-
114
-
115
-
116
-
117
-
118
-
119
-
120
-
121
-
122
-
123
-
124
-
125
-
126
-
127
-
128
-
129
-
130
-
131
-
132
-
133
-
134
-
135
-
136
-
137
-
138
-
139
-
140
-
141
-
142
-
143
-
144
-
145
-
146
-
147
-
148
-
149
-
150
-
151
-
152
-
153
-
154
-
155
-
156
-
157
-
158
-
159
-
160
-
161
-
162
-
163
-
164
-
165
-
166
-
167
-
168
-
169
-
170
-
171
-
172
-
173
-
174
-
175
-
176
-
177
-
178
-
179
-
180
-
181
-
182
-
183
-
184
-
185
-
186
-
187
-
188
-
189
-
190
-
191
-
192
-
193
-
194
-
195
-
196
-
197
-
198
-
199
-
200
-
201
-
202
-
203
-
204
-
205
-
206
-
207
-
208
-
209
-
210
-
211
-
212
-
213
-
214
-
215
-
216
-
217
-
218
-
219
-
220
-
221
-
222
-
223
-
224
-
225
-
226
-
227
-
228
-
229
-
230
-
231
-
232
-
233
-
234
-
235
-
236
-
237
 |
 |

Table of Contents
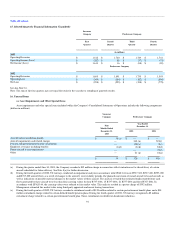
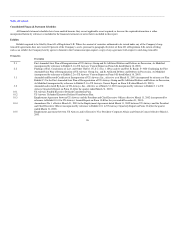
15. Selected Quarterly Financial Information (Unaudited)
Successor
Company
Predecessor Company
First
Quarter
Second
Quarter
Third
Quarter
Fourth
Quarter
(in millions)
2003
Operating Revenues $ 1,512 $ 1,760 $ 1,749 $ 1,741
Operating Income (Loss) $ (202) $ 68 $ (37) $ (73)
Net Income (Loss) $ 1,613 $ 16 $ (88) $ (89)
Predecessor Company
2002
Operating Revenues $ 1,695 $ 1,891 $ 1,735 $ 1,595
Operating Loss $ (369) $ (164) $ (182) $ (606)
Net Loss $ (298) $ (225) $ (358) $ (778)
See also Note 16.
Note: The sum of the four quarters may not equal the totals for the year due to rounding of quarterly results.
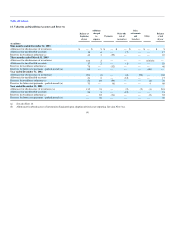
16. Unusual Items
(a) Asset Impairments and Other Special Items
Asset impairments and other special items included within the Company's Consolidated Statements of Operations includes the following components
(dollars in millions):
Successor
Company
Predecessor Company
Nine
Months Ended
December 31,
2003
Year Ended
December 31,
2002
2001
Aircraft order cancellation penalty $ 35 (a) $ — $ —
Aircraft impairments and related charges — 392 (b) 787(f)
Pension and postretirement benefit curtailments — (90)(c) 2(c)
Employee severance including benefits (1)(d) (3)(d) 83(d)
Future aircraft lease commitments — — 70(e)
Other — 21 (g) 16(g)
$ 34 $ 320 $ 958
(a) During the quarter ended June 30, 2003, the Company recorded a $35 million charge in connection with its intention not to take delivery of certain
aircraft scheduled for future delivery. See Note 8(a) for further discussion.
(b) During the fourth quarter of 2002, US Airways conducted an impairment analysis in accordance with SFAS 144 on its B737-300, B737-400, B757-200
and B767-200 aircraft fleets as a result of changes to the aircraft's recoverability periods (the planned conversion of owned aircraft to leased aircraft) as
well as indications of possible material changes to the market values of these aircraft. The analysis revealed that estimated undiscounted future cash
flows generated by these aircraft were less than their carrying values for four B737-300s, 15 B737-400s, 21 B757-200s and three B767-200s. In
accordance with SFAS 144, the carrying values were reduced to fair market value. This analysis resulted in a pretax charge of $392 million.
Management estimated fair market value using third-party appraisals and recent leasing transactions.
(c) During the fourth quarter of 2002, US Airways recorded a curtailment credit of $120 million related to certain postretirement benefit plans and a $30
million curtailment charge related to certain defined benefit pension plans. During the fourth quarter of 2001, US Airways recognized a $2 million
curtailment charge related to a certain postretirement benefit plan. These curtailments resulted from headcount reductions.
91