US Airways 2003 Annual Report Download - page 85
Download and view the complete annual report
Please find page 85 of the 2003 US Airways annual report below. You can navigate through the pages in the report by either clicking on the pages listed below, or by using the keyword search tool below to find specific information within the annual report.-
 1
1 -
2
-
3
-
4
-
5
-
6
-
7
-
8
-
9
-
10
-
11
-
12
-
13
-
14
-
15
-
16
-
17
-
18
-
19
-
20
-
21
-
22
-
23
-
24
-
25
-
26
-
27
-
28
-
29
-
30
-
31
-
32
-
33
-
34
-
35
-
36
-
37
-
38
-
39
-
40
-
41
-
42
-
43
-
44
-
45
-
46
-
47
-
48
-
49
-
50
-
51
-
52
-
53
-
54
-
55
-
56
-
57
-
58
-
59
-
60
-
61
-
62
-
63
-
64
-
65
-
66
-
67
-
68
-
69
-
70
-
71
-
72
-
73
-
74
-
 75
75 -
 76
76 -
 77
77 -
 78
78 -
 79
79 -
 80
80 -
 81
81 -
 82
82 -
 83
83 -
 84
84 -
 85
85 -
 86
86 -
 87
87 -
 88
88 -
 89
89 -
 90
90 -
 91
91 -
 92
92 -
 93
93 -
 94
94 -
 95
95 -
96
-
97
-
98
-
99
-
100
-
101
-
102
-
103
-
104
-
105
-
106
-
107
-
108
-
109
-
110
-
111
-
112
-
113
-
114
-
115
-
116
-
117
-
118
-
119
-
120
-
121
-
122
-
123
-
124
-
125
-
126
-
127
-
128
-
129
-
130
-
131
-
132
-
133
-
134
-
135
-
136
-
137
-
138
-
139
-
140
-
141
-
142
-
143
-
144
-
145
-
146
-
147
-
148
-
149
-
150
-
151
-
152
-
153
-
154
-
155
-
156
-
157
-
158
-
159
-
160
-
161
-
162
-
163
-
164
-
165
-
166
-
167
-
168
-
169
-
170
-
171
-
172
-
173
-
174
-
175
-
176
-
177
-
178
-
179
-
180
-
181
-
182
-
183
-
184
-
185
-
186
-
187
-
188
-
189
-
190
-
191
-
192
-
193
-
194
-
195
-
196
-
197
-
198
-
199
-
200
-
201
-
202
-
203
-
204
-
205
-
206
-
207
-
208
-
209
-
210
-
211
-
212
-
213
-
214
-
215
-
216
-
217
-
218
-
219
-
220
-
221
-
222
-
223
-
224
-
225
-
226
-
227
-
228
-
229
-
230
-
231
-
232
-
233
-
234
-
235
-
236
-
237
 |
 |

Table of Contents
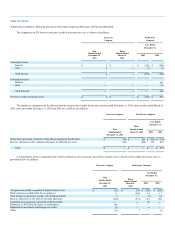
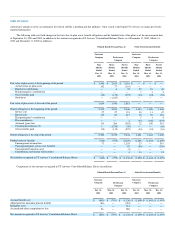
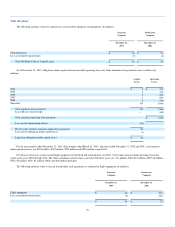
Components of the net and total periodic cost for Other Postretirement Benefits (in millions):
Successor
Company
Predecessor Company
Nine
Months
Ended
Dec. 31,
2003
Three
Months
Ended
Mar. 31,
2003
Twelve
Months
Ended
Dec. 31,
2002
Twelve
Months
Ended
Dec. 31,
2001
Service cost $ 30 $ 11 $ 47 $ 40
Interest cost 76 29 110 101
Amortization of:
Prior service benefit (10) (10) (12) (12)
Actuarial (gain) / loss — 6 — (2)
Net periodic cost 96 36 145 127
Fresh start charge — 118 — —
Curtailment — — (120) 2
Total periodic cost $ 96 $ 154 $ 25 $ 129
The change in the additional minimum pension liability included in other comprehensive income (loss) was $(86) million, $880 million, and $(742)
million for the nine months ended December 31, 2003, three months ended March 31, 2003 and year ended December 31, 2002, respectively. See Note 11 for
a reconciliation of the components of other comprehensive income.
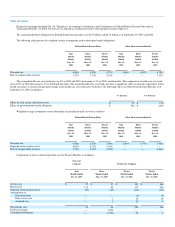
The Company expects to contribute $237 million to its defined benefit pension plans and $69 million to its other postretirement benefit plans in 2004.
In addition, the following benefits, which reflected expected future service, as appropriate, are expected to be paid from the plans (in millions):
Defined Benefit
Pension Plans
Other
Postretirement
Benefits
2004 $ 115 $ 69
2005 115 73
2006 117 76
2007 119 79
2008 123 82
2009 to 2013 717 454
US Airways assumed that its pension plans' assets would generate a long-term rate of return of 8.00% at September 30, 2003. This rate is lower than the
assumed rate of 8.75% used at September 30, 2002. The expected long-term rate of return assumption is developed by evaluating input from the plan's
investment consultants, including their review of asset class return expectations and long-term inflation assumptions.
The weighted average asset allocations at September 30, 2003 and 2002, by asset category are as follows:
Plan Assets
2003
2002
Equity securities 38% 39%
Debt securities 46 45
Real estate 4 4
Other 12 12
Total 100% 100%
US Airways targeted asset allocation is approximately 35% equity securities, 45% debt securities, 10% real estate and 10% other. US Airways believes
that its long-term asset allocation
75