US Airways 2003 Annual Report Download - page 36
Download and view the complete annual report
Please find page 36 of the 2003 US Airways annual report below. You can navigate through the pages in the report by either clicking on the pages listed below, or by using the keyword search tool below to find specific information within the annual report.-
 1
1 -
2
-
3
-
4
-
5
-
6
-
7
-
8
-
9
-
10
-
11
-
12
-
13
-
14
-
15
-
16
-
17
-
18
-
19
-
20
-
21
-
22
-
23
-
24
-
25
-
 26
26 -
 27
27 -
 28
28 -
 29
29 -
 30
30 -
 31
31 -
 32
32 -
 33
33 -
 34
34 -
 35
35 -
 36
36 -
 37
37 -
 38
38 -
 39
39 -
 40
40 -
 41
41 -
 42
42 -
 43
43 -
 44
44 -
 45
45 -
 46
46 -
47
-
48
-
49
-
50
-
51
-
52
-
53
-
54
-
55
-
56
-
57
-
58
-
59
-
60
-
61
-
62
-
63
-
64
-
65
-
66
-
67
-
68
-
69
-
70
-
71
-
72
-
73
-
74
-
75
-
76
-
77
-
78
-
79
-
80
-
81
-
82
-
83
-
84
-
85
-
86
-
87
-
88
-
89
-
90
-
91
-
92
-
93
-
94
-
95
-
96
-
97
-
98
-
99
-
100
-
101
-
102
-
103
-
104
-
105
-
106
-
107
-
108
-
109
-
110
-
111
-
112
-
113
-
114
-
115
-
116
-
117
-
118
-
119
-
120
-
121
-
122
-
123
-
124
-
125
-
126
-
127
-
128
-
129
-
130
-
131
-
132
-
133
-
134
-
135
-
136
-
137
-
138
-
139
-
140
-
141
-
142
-
143
-
144
-
145
-
146
-
147
-
148
-
149
-
150
-
151
-
152
-
153
-
154
-
155
-
156
-
157
-
158
-
159
-
160
-
161
-
162
-
163
-
164
-
165
-
166
-
167
-
168
-
169
-
170
-
171
-
172
-
173
-
174
-
175
-
176
-
177
-
178
-
179
-
180
-
181
-
182
-
183
-
184
-
185
-
186
-
187
-
188
-
189
-
190
-
191
-
192
-
193
-
194
-
195
-
196
-
197
-
198
-
199
-
200
-
201
-
202
-
203
-
204
-
205
-
206
-
207
-
208
-
209
-
210
-
211
-
212
-
213
-
214
-
215
-
216
-
217
-
218
-
219
-
220
-
221
-
222
-
223
-
224
-
225
-
226
-
227
-
228
-
229
-
230
-
231
-
232
-
233
-
234
-
235
-
236
-
237
 |
 |

Table of Contents
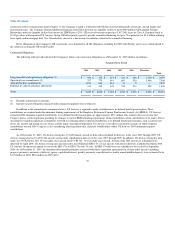
Selected Operating and Financial Statistics (1)
Twelve Months Ended December 31,
2003
2002
2001
Revenue passengers miles (millions):*
System 41,464 43,374 48,685
Mainline 37,741 40,038 45,948
Available seat miles (millions):*
System 58,017 62,329 71,726
Mainline 51,494 56,360 66,704
Total available seat miles (millions):
System 58,106 62,343 71,766
Mainline 51,583 56,373 66,744
Passenger load factor (2):*
System 71.5% 69.6% 67.9%
Mainline 73.3% 71.0% 68.9%
Yield (3):*
System 14.79¢ 14.48¢ 15.48¢
Mainline (4) 13.05¢ 13.05¢ 14.32¢
Passenger revenue per available seat mile (5):*
System 10.57¢ 10.08¢ 10.51¢
Mainline (4) 9.56¢ 9.27¢ 9.86¢
Revenue passengers (thousands):*
System 52,797 58,389 65,407
Mainline 41,251 47,155 56,114
Mainline revenue per available seat mile (6) 10.75¢ 10.38¢ 10.92¢
Mainline cost per available seat mile "Mainline CASM" (7)(8) 11.36¢ 12.67¢ 13.43¢
Mainline average stage length (miles)* 761 685 667
Mainline cost of aviation fuel per gallon (9) 88.29¢ 74.36¢ 86.28¢
Mainline cost of aviation fuel per gallon (excluding fuel taxes) 83.02¢ 68.90¢ 80.09¢
Mainline gallons of aviation fuel consumed (millions) 873 972 1,208
Mainline number of aircraft in operating fleet at period-end 282 280 342
Mainline full-time equivalent employees at period end 26,797 30,585 35,232
* Denotes scheduled service only (excludes charter service).
(1) Operating statistics include free frequent travelers and the related miles they flew. System statistics encompass all wholly owned airline subsidiaries of
US Airways Group, including US Airways, Allegheny Airlines, Piedmont Airlines, PSA Airlines as well as operating and financial results from
capacity purchase agreements with Mesa Airlines, Chautauqua Airlines, Trans States Airlines and Midway Airlines. Where noted, unusual items (see
above for additional information) and revenues and expenses associated with US Airways' capacity purchase arrangements with certain affiliated
airlines have been excluded from US Airways' financial results for purposes of mainline financial statistical calculation and to provide better
comparability between periods.
(2) Percentage of aircraft seating capacity that is actually utilized (RPMs/ASMs).
(3) Passenger transportation revenue divided by RPMs.
(4) Mainline passenger revenue excludes US Airways Express passenger revenue of $1,208 million, $1,058 million and $957 million for the years ended
December 31, 2003, 2002 and 2001, respectively.
(5) Passenger transportation revenue divided by ASMs (a measure of unit revenue).
(6) Mainline operating revenues divided by ASMs (a measure of unit revenue). Mainline operating revenues exclude US Airways Express operating
revenues of $1,214 million, $1,063 million and $962 million for the years ended December 31, 2003, 2002 and 2001, respectively.
(7) Total Operating Expenses divided by ASMs (a measure of unit cost).
(8) Mainline operating expenses exclude US Airways Express capacity purchases of $1,145 million, $1,094 million and $908 million for the years ended
December 31, 2003, 2002 and 2001, respectively. Operating expenses for each period include unusual items as follows:
nFor the year ended December 31, 2003, operating expenses include an aircraft order penalty of $35 million (0.07¢) and government
compensation of $212 million (0.41¢).
nFor the year ended December 31, 2002, operating expenses include aircraft impairment and related charges of $392 million (0.70¢), a benefit on
the pension and postretirement curtailment of $90 million (0.16¢), and impairment charge related to capitalized gates at certain airports of $21
million (0.04¢) and a reduction to the involuntary severance accrual of $3 million (0.01¢).
nFor the year ended December 31, 2001, operating expenses include aircraft impairment and related charges of $958 million (1.44¢) and
government compensation of $309 million (0.46¢).
(9) Includes fuel taxes and transportation charges and excludes service fees.
31