US Airways 2003 Annual Report Download - page 70
Download and view the complete annual report
Please find page 70 of the 2003 US Airways annual report below. You can navigate through the pages in the report by either clicking on the pages listed below, or by using the keyword search tool below to find specific information within the annual report.-
 1
1 -
2
-
3
-
4
-
5
-
6
-
7
-
8
-
9
-
10
-
11
-
12
-
13
-
14
-
15
-
16
-
17
-
18
-
19
-
20
-
21
-
22
-
23
-
24
-
25
-
26
-
27
-
28
-
29
-
30
-
31
-
32
-
33
-
34
-
35
-
36
-
37
-
38
-
39
-
40
-
41
-
42
-
43
-
44
-
45
-
46
-
47
-
48
-
49
-
50
-
51
-
52
-
53
-
54
-
55
-
56
-
57
-
58
-
59
-
 60
60 -
 61
61 -
 62
62 -
 63
63 -
 64
64 -
 65
65 -
 66
66 -
 67
67 -
 68
68 -
 69
69 -
 70
70 -
 71
71 -
 72
72 -
 73
73 -
 74
74 -
 75
75 -
 76
76 -
 77
77 -
 78
78 -
 79
79 -
 80
80 -
81
-
82
-
83
-
84
-
85
-
86
-
87
-
88
-
89
-
90
-
91
-
92
-
93
-
94
-
95
-
96
-
97
-
98
-
99
-
100
-
101
-
102
-
103
-
104
-
105
-
106
-
107
-
108
-
109
-
110
-
111
-
112
-
113
-
114
-
115
-
116
-
117
-
118
-
119
-
120
-
121
-
122
-
123
-
124
-
125
-
126
-
127
-
128
-
129
-
130
-
131
-
132
-
133
-
134
-
135
-
136
-
137
-
138
-
139
-
140
-
141
-
142
-
143
-
144
-
145
-
146
-
147
-
148
-
149
-
150
-
151
-
152
-
153
-
154
-
155
-
156
-
157
-
158
-
159
-
160
-
161
-
162
-
163
-
164
-
165
-
166
-
167
-
168
-
169
-
170
-
171
-
172
-
173
-
174
-
175
-
176
-
177
-
178
-
179
-
180
-
181
-
182
-
183
-
184
-
185
-
186
-
187
-
188
-
189
-
190
-
191
-
192
-
193
-
194
-
195
-
196
-
197
-
198
-
199
-
200
-
201
-
202
-
203
-
204
-
205
-
206
-
207
-
208
-
209
-
210
-
211
-
212
-
213
-
214
-
215
-
216
-
217
-
218
-
219
-
220
-
221
-
222
-
223
-
224
-
225
-
226
-
227
-
228
-
229
-
230
-
231
-
232
-
233
-
234
-
235
-
236
-
237
 |
 |
Table of Contents
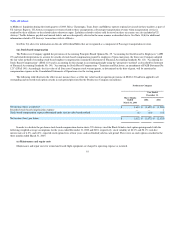
3. Fresh-start Reporting, Reorganization Items and Liabilities Subject to Compromise
(a) Fresh-start Reporting
In connection with its emergence from bankruptcy on March 31, 2003, US Airways adopted fresh-start reporting in accordance with SOP 90-7.
Accordingly, the Company valued its assets, liabilities and equity at fair value. The excess of the reorganization value over tangible assets and identifiable
intangible assets has been reflected as Goodwill on the Consolidated Balance Sheet. Estimates of fair value represent the Company's best estimate based on
independent appraisals and valuations and, where the foregoing are not available, industry trends and by reference to market rates and transactions. US
Airway Group's equity value of $438 million at March 31, 2003 was determined with the assistance of financial advisors. In determining the equity value, the
financial advisors and US Airways Group considered several matters, including the following: (i) certain recent financial information of US Airways Group;
(ii) certain financial projections prepared by US Airways Group in connection with the ATSB Loan and RSA Investment Agreement including the underlying
assumptions; (iii) the equity transactions encompassed by the RSA Investment Agreement; (iv) a discounted cash flow analysis prepared on a going concern
basis; (v) current and historical market values of publicly traded companies that are in businesses reasonably comparable to US Airways Group and (vi)
certain additional economic and industry conditions. The Company's equity value of $349 million was determined based on a review of each of US Airways
Group's subsidiaries' fair value of assets and liabilities. The Company received third party appraisals for certain assets and liabilities subsequent to March 31,
2003. Changes in the fair value of these assets and liabilities from the previously estimated values had an impact on the reported value of Goodwill. See Note
(c) to the table below for changes in Goodwill since March 31, 2003 as a result of the completion of certain appraisals. The foregoing estimates and
assumptions are inherently subject to significant uncertainties and contingencies beyond the control of the Company. Accordingly, there can be no assurance
that the estimates, assumptions, and values reflected in the valuations will be realized, and actual results could vary materially.
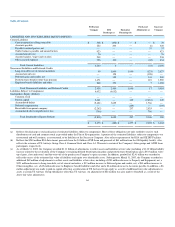
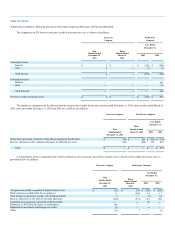
As a result of the adoption of fresh-start reporting, the Company's post-emergence financial statements are not comparable with its pre-emergence
financial statements, because they are, in effect, those of a new entity. The effects of the Plan of Reorganization and fresh-start reporting through December
31, 2003 on the Company's Consolidated Balance Sheet as of March 31, 2003 are as follows (in millions):
Predecessor
Company
Debt
Discharge (a)
Emergence
Financings (b)
Fresh-start
Adjustments (c)
Successor
Company
ASSETS
Current Assets
Cash and cash equivalents $ 323 $ (431) $ 1,303 $ — $ 1,195
Short-term investments 68 — — — 68
Receivables from related parties, net 115 (51) (26) (38) —
Other current assets 744 — — 30 774
Total Current Assets 1,250 (482) 1,277 (8) 2,037
Property and Equipment, net 3,021 — — (156) 2,865
Other Assets
Goodwill 531 — — 1,944 2,475
Other intangibles, net 237 — — 332 569
Restricted cash 383 — — — 383
Other assets, net 53 — — (20) 33
Total Other Assets 1,204 — — 2,256 3,460
$ 5,475 $ (482) $ 1,277 $ 2,092 $ 8,362
63