UPS 2015 Annual Report Download - page 97
Download and view the complete annual report
Please find page 97 of the 2015 UPS annual report below. You can navigate through the pages in the report by either clicking on the pages listed below, or by using the keyword search tool below to find specific information within the annual report.-
 1
1 -
2
-
3
-
4
-
5
-
6
-
7
-
8
-
9
-
10
-
11
-
12
-
13
-
14
-
15
-
16
-
17
-
18
-
19
-
20
-
21
-
22
-
23
-
24
-
25
-
26
-
27
-
28
-
29
-
30
-
31
-
32
-
33
-
34
-
35
-
36
-
37
-
38
-
39
-
40
-
41
-
42
-
43
-
44
-
45
-
46
-
47
-
48
-
49
-
50
-
51
-
52
-
53
-
54
-
55
-
56
-
57
-
58
-
59
-
60
-
61
-
62
-
63
-
64
-
65
-
66
-
67
-
68
-
69
-
70
-
71
-
72
-
73
-
74
-
75
-
76
-
77
-
78
-
79
-
80
-
81
-
82
-
83
-
84
-
85
-
86
-
 87
87 -
 88
88 -
 89
89 -
 90
90 -
 91
91 -
 92
92 -
 93
93 -
 94
94 -
 95
95 -
 96
96 -
 97
97 -
 98
98 -
 99
99 -
 100
100 -
 101
101 -
 102
102 -
 103
103 -
 104
104 -
 105
105 -
 106
106 -
 107
107 -
108
-
109
-
110
-
111
-
112
-
113
-
114
-
115
-
116
-
117
-
118
-
119
-
120
-
121
-
122
-
123
-
124
-
125
-
126
-
127
-
128
-
129
-
130
-
131
-
132
-
133
-
134
-
135
-
136
-
137
-
138
-
139
-
140
-
141
-
142
-
143
-
144
-
145
-
146
-
147
-
148
 |
 |

UNITED PARCEL SERVICE, INC. AND SUBSIDIARIES
NOTES TO CONSOLIDATED FINANCIAL STATEMENTS
85
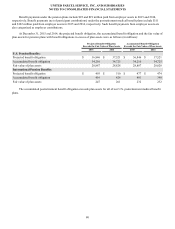
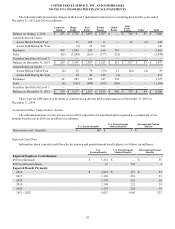
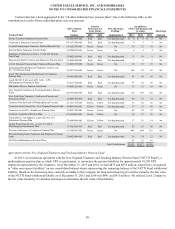
The following table presents the changes in the Level 3 instruments measured on a recurring basis for the years ended
December 31, 2015 and 2014 (in millions).
Corporate
Bonds
Hedge
Funds
Real
Estate
Private
Equity
Global
Bonds
Risk
Parity
Funds Other Total
Balance on January 1, 2014 $ 223 $ 3,738 $ 1,091 $ 1,397 $ — $ 756 $ 55 $ 7,260
Actual Return on Assets:
Assets Held at End of Year — 71 104 11 — 61 (2) 245
Assets Sold During the Year — (9) 23 126 — — — 140
Purchases 108 1,043 350 166 735 — — 2,402
Sales (62) (1,248) (261)(377)(122)— —
(2,070)
Transfers Into (Out of) Level 3 — — — — — — — —
Balance on December 31, 2014 $ 269 $ 3,595 $ 1,307 $ 1,323 $ 613 $ 817 $ 53 $ 7,977
Actual Return on Assets:
Assets Held at End of Year (8) 62 79 (39)11(62)(4)39
Assets Sold During the Year — 39 45 149 (2) — — 231
Purchases 22 283 545 347 130 — — 1,327
Sales (4) (362) (409)(365)(166)— —
(1,306)
Transfers Into (Out of) Level 3 — — — — — — — —
Balance on December 31, 2015 $ 279 $ 3,617 $ 1,567 $ 1,415 $ 586 $ 755 $ 49 $ 8,268
There were no UPS class A or B shares of common stock directly held in plan assets as of December 31, 2015 or
December 31, 2014.
Accumulated Other Comprehensive Income
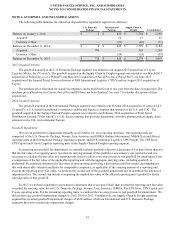
The estimated amounts of prior service cost in AOCI expected to be amortized and recognized as a component of net
periodic benefit cost in 2016 are as follows (in millions):
U.S. Pension Benefits
U.S. Postretirement
Medical Benefits
International Pension
Benefits
Prior service cost / (benefit) $ 166 $ 5 $ 1
Expected Cash Flows
Information about expected cash flows for the pension and postretirement benefit plans is as follows (in millions):
U.S.
Pension Benefits
U.S. Postretirement
Medical Benefits
International Pension
Benefits
Expected Employer Contributions:
2016 to plan trusts $ 1,161 $ — $ 55
2016 to plan participants 16 101 3
Expected Benefit Payments:
2016 $ 1,067 $ 237 $ 23
2017 1,168 236 23
2018 1,278 232 26
2019 1,398 232 29
2020 1,529 228 32
2021 - 2025 9,822 1,005 222