UPS 2015 Annual Report Download - page 77
Download and view the complete annual report
Please find page 77 of the 2015 UPS annual report below. You can navigate through the pages in the report by either clicking on the pages listed below, or by using the keyword search tool below to find specific information within the annual report.-
 1
1 -
2
-
3
-
4
-
5
-
6
-
7
-
8
-
9
-
10
-
11
-
12
-
13
-
14
-
15
-
16
-
17
-
18
-
19
-
20
-
21
-
22
-
23
-
24
-
25
-
26
-
27
-
28
-
29
-
30
-
31
-
32
-
33
-
34
-
35
-
36
-
37
-
38
-
39
-
40
-
41
-
42
-
43
-
44
-
45
-
46
-
47
-
48
-
49
-
50
-
51
-
52
-
53
-
54
-
55
-
56
-
57
-
58
-
59
-
60
-
61
-
62
-
63
-
64
-
65
-
66
-
 67
67 -
 68
68 -
 69
69 -
 70
70 -
 71
71 -
 72
72 -
 73
73 -
 74
74 -
 75
75 -
 76
76 -
 77
77 -
 78
78 -
 79
79 -
 80
80 -
 81
81 -
 82
82 -
 83
83 -
 84
84 -
 85
85 -
 86
86 -
 87
87 -
88
-
89
-
90
-
91
-
92
-
93
-
94
-
95
-
96
-
97
-
98
-
99
-
100
-
101
-
102
-
103
-
104
-
105
-
106
-
107
-
108
-
109
-
110
-
111
-
112
-
113
-
114
-
115
-
116
-
117
-
118
-
119
-
120
-
121
-
122
-
123
-
124
-
125
-
126
-
127
-
128
-
129
-
130
-
131
-
132
-
133
-
134
-
135
-
136
-
137
-
138
-
139
-
140
-
141
-
142
-
143
-
144
-
145
-
146
-
147
-
148
 |
 |

65
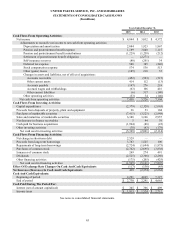
UNITED PARCEL SERVICE, INC. AND SUBSIDIARIES
STATEMENTS OF CONSOLIDATED CASH FLOWS
(In millions)
Years Ended December 31,
2015 2014 2013
Cash Flows From Operating Activities:
Net income $ 4,844 $ 3,032 $ 4,372
Adjustments to reconcile net income to net cash from operating activities:
Depreciation and amortization 2,084 1,923 1,867
Pension and postretirement benefit expense 1,189 3,040 1,115
Pension and postretirement benefit contributions (1,229) (1,258) (212)
Settlement of postretirement benefit obligation — (2,271) —
Self-insurance reserves (80) (201) 34
Deferred tax expense 540 385 (246)
Stock compensation expense 574 536 513
Other (gains) losses (185) 218 35
Changes in assets and liabilities, net of effect of acquisitions:
Accounts receivable (452) (523) (515)
Other current assets 414 112 (13)
Accounts payable (147) 276 218
Accrued wages and withholdings (63) 106 416
Other current liabilities (6) 317 (140)
Other operating activities (53) 34 (140)
Net cash from operating activities 7,430 5,726 7,304
Cash Flows From Investing Activities:
Capital expenditures (2,379) (2,328) (2,065)
Proceeds from disposals of property, plant and equipment 26 53 104
Purchases of marketable securities (7,415) (3,525) (2,948)
Sales and maturities of marketable securities 6,388 3,106 2,957
Net decrease in finance receivables 5 44 39
Cash paid for business acquisitions (1,904) (88) (22)
Other investing activities (30) (63) (179)
Net cash used in investing activities (5,309) (2,801) (2,114)
Cash Flows From Financing Activities:
Net change in short-term debt 2,529 — —
Proceeds from long-term borrowings 3,783 1,525 100
Repayments of long-term borrowings (2,724) (1,694) (1,875)
Purchases of common stock (2,702) (2,695) (3,838)
Issuances of common stock 249 274 491
Dividends (2,525) (2,366) (2,260)
Other financing activities (175) (205) (425)
Net cash used in financing activities (1,565) (5,161) (7,807)
Effect Of Exchange Rate Changes On Cash And Cash Equivalents (117) (138) (45)
Net Increase (Decrease) In Cash And Cash Equivalents 439 (2,374) (2,662)
Cash And Cash Equivalents:
Beginning of period 2,291 4,665 7,327
End of period $ 2,730 $ 2,291 $ 4,665
Cash Paid During The Period For:
Interest (net of amount capitalized) $ 345 $ 366 $ 409
Income taxes $ 1,913 $ 1,524 $ 2,712
See notes to consolidated financial statements.