UPS 2015 Annual Report Download - page 50
Download and view the complete annual report
Please find page 50 of the 2015 UPS annual report below. You can navigate through the pages in the report by either clicking on the pages listed below, or by using the keyword search tool below to find specific information within the annual report.-
 1
1 -
2
-
3
-
4
-
5
-
6
-
7
-
8
-
9
-
10
-
11
-
12
-
13
-
14
-
15
-
16
-
17
-
18
-
19
-
20
-
21
-
22
-
23
-
24
-
25
-
26
-
27
-
28
-
29
-
30
-
31
-
32
-
33
-
34
-
35
-
36
-
37
-
38
-
39
-
 40
40 -
 41
41 -
 42
42 -
 43
43 -
 44
44 -
 45
45 -
 46
46 -
 47
47 -
 48
48 -
 49
49 -
 50
50 -
 51
51 -
 52
52 -
 53
53 -
 54
54 -
 55
55 -
 56
56 -
 57
57 -
 58
58 -
 59
59 -
 60
60 -
61
-
62
-
63
-
64
-
65
-
66
-
67
-
68
-
69
-
70
-
71
-
72
-
73
-
74
-
75
-
76
-
77
-
78
-
79
-
80
-
81
-
82
-
83
-
84
-
85
-
86
-
87
-
88
-
89
-
90
-
91
-
92
-
93
-
94
-
95
-
96
-
97
-
98
-
99
-
100
-
101
-
102
-
103
-
104
-
105
-
106
-
107
-
108
-
109
-
110
-
111
-
112
-
113
-
114
-
115
-
116
-
117
-
118
-
119
-
120
-
121
-
122
-
123
-
124
-
125
-
126
-
127
-
128
-
129
-
130
-
131
-
132
-
133
-
134
-
135
-
136
-
137
-
138
-
139
-
140
-
141
-
142
-
143
-
144
-
145
-
146
-
147
-
148
 |
 |

UNITED PARCEL SERVICE, INC. AND SUBSIDIARIES
MANAGEMENT'S DISCUSSION AND ANALYSIS OF FINANCIAL CONDITION AND
RESULTS OF OPERATIONS
38
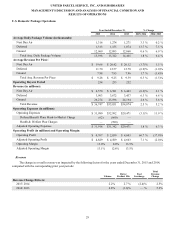
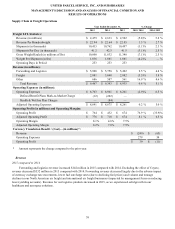
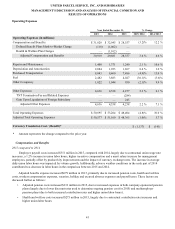
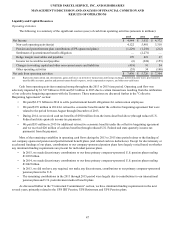
Supply Chain & Freight Operations
Year Ended December 31, % Change
2015 2014 2013 2015/ 2014 2014/ 2013
Freight LTL Statistics:
Revenue (in millions) $ 2,479 $ 2,633 $ 2,502 (5.8)% 5.2 %
Revenue Per Hundredweight $ 22.94 $ 22.64 $ 22.05 1.3 % 2.7 %
Shipments (in thousands) 10,433 10,762 10,497 (3.1)% 2.5 %
Shipments Per Day (in thousands) 41.2 42.5 41.5 (3.1)% 2.5 %
Gross Weight Hauled (in millions of lbs) 10,808 11,632 11,348 (7.1)% 2.5 %
Weight Per Shipment (in lbs) 1,036 1,081 1,081 (4.2)% — %
Operating Days in Period 253 253 253
Revenue (in millions):
Forwarding and Logistics $ 5,900 $ 5,758 $ 5,492 2.5 % 4.8 %
Freight 2,881 3,048 2,882 (5.5)% 5.8 %
Other 686 587 561 16.9 % 4.6 %
Total Revenue $ 9,467 $ 9,393 $ 8,935 0.8 % 5.1 %
Operating Expenses (in millions):
Operating Expenses $ 8,703 $ 8,961 $ 8,261 (2.9)% 8.5 %
Defined Benefit Plans Mark-to-Market Charge (12)(202)—
Health & Welfare Plan Charges — (84)—
Adjusted Operating Expenses $ 8,691 $ 8,675 $ 8,261 0.2 % 5.0 %
Operating Profit (in millions) and Operating Margins:
Operating Profit $ 764 $ 432 $ 674 76.9 % (35.9)%
Adjusted Operating Profit $ 776 $ 718 $ 674 8.1 % 6.5 %
Operating Margin 8.1% 4.6% 7.5%
Adjusted Operating Margin 8.2% 7.6% 7.5%
Currency Translation Benefit / (Cost)—(in millions)*:
Revenue $ (249) $ (65)
Operating Expenses 279 54
Operating Profit $ 30 $ (11)
* Amount represents the change compared to the prior year.
Revenue
2015 compared to 2014
Forwarding and logistics revenue increased $142 million in 2015 compared with 2014. Excluding the effect of Coyote,
revenue decreased $532 million in 2015 compared with 2014. Forwarding revenue decreased largely due to the adverse impact
of currency exchange rate movements, lower fuel surcharge rates (due to declining fuel prices) and volume and tonnage
declines in our North American air freight and international air freight businesses (impacted by management focus on reducing
lower-yielding accounts). Revenue for our logistics products increased in 2015, as we experienced solid growth in our
healthcare and aerospace solutions.