UPS 2015 Annual Report Download - page 60
Download and view the complete annual report
Please find page 60 of the 2015 UPS annual report below. You can navigate through the pages in the report by either clicking on the pages listed below, or by using the keyword search tool below to find specific information within the annual report.-
 1
1 -
2
-
3
-
4
-
5
-
6
-
7
-
8
-
9
-
10
-
11
-
12
-
13
-
14
-
15
-
16
-
17
-
18
-
19
-
20
-
21
-
22
-
23
-
24
-
25
-
26
-
27
-
28
-
29
-
30
-
31
-
32
-
33
-
34
-
35
-
36
-
37
-
38
-
39
-
40
-
41
-
42
-
43
-
44
-
45
-
46
-
47
-
48
-
49
-
 50
50 -
 51
51 -
 52
52 -
 53
53 -
 54
54 -
 55
55 -
 56
56 -
 57
57 -
 58
58 -
 59
59 -
 60
60 -
 61
61 -
 62
62 -
 63
63 -
 64
64 -
 65
65 -
 66
66 -
 67
67 -
 68
68 -
 69
69 -
 70
70 -
71
-
72
-
73
-
74
-
75
-
76
-
77
-
78
-
79
-
80
-
81
-
82
-
83
-
84
-
85
-
86
-
87
-
88
-
89
-
90
-
91
-
92
-
93
-
94
-
95
-
96
-
97
-
98
-
99
-
100
-
101
-
102
-
103
-
104
-
105
-
106
-
107
-
108
-
109
-
110
-
111
-
112
-
113
-
114
-
115
-
116
-
117
-
118
-
119
-
120
-
121
-
122
-
123
-
124
-
125
-
126
-
127
-
128
-
129
-
130
-
131
-
132
-
133
-
134
-
135
-
136
-
137
-
138
-
139
-
140
-
141
-
142
-
143
-
144
-
145
-
146
-
147
-
148
 |
 |
UNITED PARCEL SERVICE, INC. AND SUBSIDIARIES
MANAGEMENT'S DISCUSSION AND ANALYSIS OF FINANCIAL CONDITION AND
RESULTS OF OPERATIONS
48
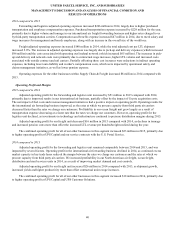
Apart from the transactions described above, operating cash flow was impacted by changes in our working capital
position, payments for income taxes, and changes in hedge margin payables and receivables. Cash payments for income taxes
were $1.913, $1.524 and $2.712 billion for 2015, 2014 and 2013, respectively, and were primarily impacted by the timing of
current tax deductions. The net hedge margin collateral received from derivative counterparties was $170, $421and $67 million
during 2015, 2014 and 2013, respectively, due to the increased net fair value asset position of the derivative contracts used in
our currency and interest rate hedging programs.
As of December 31, 2015, the total of our worldwide holdings of cash, cash equivalents and marketable securities were
$4.726 billion, of which $2.516 billion was held by foreign subsidiaries. The amount of cash, cash equivalents and marketable
securities held by our U.S. and foreign subsidiaries fluctuates throughout the year due to a variety of factors, including the
timing of cash receipts and disbursements in the normal course of business. Cash provided by operating activities in the United
States continues to be our primary source of funds to finance domestic operating needs, capital expenditures, share repurchases
and dividend payments to shareowners. To the extent that such amounts represent previously untaxed earnings, the cash, cash
equivalents and marketable securities held by foreign subsidiaries would be subject to tax if such amounts were repatriated in
the form of dividends; however, not all international balances would have to be repatriated in the form of a dividend if returned
to the U.S. When amounts earned by foreign subsidiaries are expected to be indefinitely reinvested, no accrual for taxes is
provided.
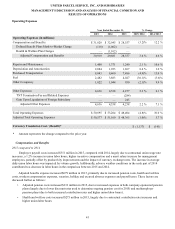
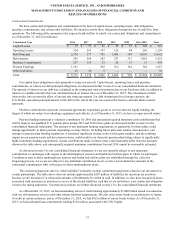
Investing Activities
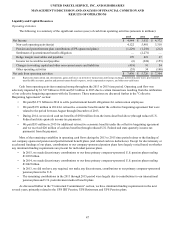
Our primary sources (uses) of cash for investing activities were as follows (amounts in millions):
2015 2014 2013
Net cash used in investing activities $ (5,309)$(2,801)$(2,114)
Capital Expenditures:
Buildings and facilities $ (996)$ (808)$ (483)
Aircraft and parts (27)(44)(478)
Vehicles (936)(1,061)(662)
Information technology (420)(415)(442)
$(2,379)$(2,328)$(2,065)
Capital Expenditures as a % of Revenue 4.1% 4.0% 3.7%
Other Investing Activities:
Proceeds from disposals of property, plant and equipment $ 26 $ 53 $ 104
Net decrease in finance receivables $ 5 $ 44 $ 39
Net (purchases) sales of marketable securities $ (1,027)$ (419)$ 9
Cash received (paid) for business acquisitions and dispositions $ (1,904)$ (88)$ (22)
Other investing activities $ (30)$ (63)$ (179)
We have commitments for the purchase of vehicles, equipment and real estate to provide for the replacement of existing
capacity and anticipated future growth. We generally fund our capital expenditures with our cash from operations. Future
capital spending for anticipated growth and replacement assets will depend on a variety of factors, including economic and
industry conditions. We anticipate that our capital expenditures for 2016 will be approximately $2.8 billion.
Capital spending on aircraft declined over the 2013 to 2015 period, as we completed the scheduled deliveries of a
previous order for the Boeing 767-300ERF aircraft in 2013. Capital spending on vehicles increased during the 2013 to 2015
period in our U.S. and international package businesses and our freight unit, due to vehicle replacements, technology
enhancements and new vehicle orders to support volume growth. Capital expenditures on buildings and facilities also increased
in the 2013 to 2015 period, and included hub automation and capacity expansion projects in the U.S. during 2015, as well as
expansion and new construction projects at facilities in Europe and Asia (including a $200 million expansion at our European
air hub in Cologne, Germany that was completed in 2014).