UPS 2015 Annual Report Download - page 76
Download and view the complete annual report
Please find page 76 of the 2015 UPS annual report below. You can navigate through the pages in the report by either clicking on the pages listed below, or by using the keyword search tool below to find specific information within the annual report.-
 1
1 -
2
-
3
-
4
-
5
-
6
-
7
-
8
-
9
-
10
-
11
-
12
-
13
-
14
-
15
-
16
-
17
-
18
-
19
-
20
-
21
-
22
-
23
-
24
-
25
-
26
-
27
-
28
-
29
-
30
-
31
-
32
-
33
-
34
-
35
-
36
-
37
-
38
-
39
-
40
-
41
-
42
-
43
-
44
-
45
-
46
-
47
-
48
-
49
-
50
-
51
-
52
-
53
-
54
-
55
-
56
-
57
-
58
-
59
-
60
-
61
-
62
-
63
-
64
-
65
-
 66
66 -
 67
67 -
 68
68 -
 69
69 -
 70
70 -
 71
71 -
 72
72 -
 73
73 -
 74
74 -
 75
75 -
 76
76 -
 77
77 -
 78
78 -
 79
79 -
 80
80 -
 81
81 -
 82
82 -
 83
83 -
 84
84 -
 85
85 -
 86
86 -
87
-
88
-
89
-
90
-
91
-
92
-
93
-
94
-
95
-
96
-
97
-
98
-
99
-
100
-
101
-
102
-
103
-
104
-
105
-
106
-
107
-
108
-
109
-
110
-
111
-
112
-
113
-
114
-
115
-
116
-
117
-
118
-
119
-
120
-
121
-
122
-
123
-
124
-
125
-
126
-
127
-
128
-
129
-
130
-
131
-
132
-
133
-
134
-
135
-
136
-
137
-
138
-
139
-
140
-
141
-
142
-
143
-
144
-
145
-
146
-
147
-
148
 |
 |

64
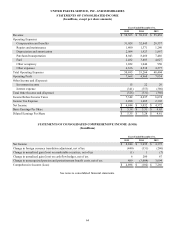
UNITED PARCEL SERVICE, INC. AND SUBSIDIARIES
STATEMENTS OF CONSOLIDATED INCOME
(In millions, except per share amounts)
Years Ended December 31,
2015 2014 2013
Revenue $ 58,363 $ 58,232 $ 55,438
Operating Expenses:
Compensation and benefits 31,028 32,045 28,557
Repairs and maintenance 1,400 1,371 1,240
Depreciation and amortization 2,084 1,923 1,867
Purchased transportation 8,043 8,460 7,486
Fuel 2,482 3,883 4,027
Other occupancy 1,022 1,044 950
Other expenses 4,636 4,538 4,277
Total Operating Expenses 50,695 53,264 48,404
Operating Profit 7,668 4,968 7,034
Other Income and (Expense):
Investment income 15 22 20
Interest expense (341)(353)(380)
Total Other Income and (Expense) (326)(331)(360)
Income Before Income Taxes 7,342 4,637 6,674
Income Tax Expense 2,498 1,605 2,302
Net Income $ 4,844 $ 3,032 $ 4,372
Basic Earnings Per Share $ 5.38 $ 3.31 $ 4.65
Diluted Earnings Per Share $ 5.35 $ 3.28 $ 4.61
STATEMENTS OF CONSOLIDATED COMPREHENSIVE INCOME (LOSS)
(In millions)
Years Ended December 31,
2015 2014 2013
Net Income $ 4,844 $ 3,032 $ 4,372
Change in foreign currency translation adjustment, net of tax (440)(331)(260)
Change in unrealized gain (loss) on marketable securities, net of tax (1)1(7)
Change in unrealized gain (loss) on cash flow hedges, net of tax 6 280 67
Change in unrecognized pension and postretirement benefit costs, net of tax 489 (3,084) 3,094
Comprehensive Income (Loss) $ 4,898 $ (102) $ 7,266
See notes to consolidated financial statements.