UPS 2015 Annual Report Download - page 37
Download and view the complete annual report
Please find page 37 of the 2015 UPS annual report below. You can navigate through the pages in the report by either clicking on the pages listed below, or by using the keyword search tool below to find specific information within the annual report.-
 1
1 -
2
-
3
-
4
-
5
-
6
-
7
-
8
-
9
-
10
-
11
-
12
-
13
-
14
-
15
-
16
-
17
-
18
-
19
-
20
-
21
-
22
-
23
-
24
-
25
-
26
-
 27
27 -
 28
28 -
 29
29 -
 30
30 -
 31
31 -
 32
32 -
 33
33 -
 34
34 -
 35
35 -
 36
36 -
 37
37 -
 38
38 -
 39
39 -
 40
40 -
 41
41 -
 42
42 -
 43
43 -
 44
44 -
 45
45 -
 46
46 -
 47
47 -
48
-
49
-
50
-
51
-
52
-
53
-
54
-
55
-
56
-
57
-
58
-
59
-
60
-
61
-
62
-
63
-
64
-
65
-
66
-
67
-
68
-
69
-
70
-
71
-
72
-
73
-
74
-
75
-
76
-
77
-
78
-
79
-
80
-
81
-
82
-
83
-
84
-
85
-
86
-
87
-
88
-
89
-
90
-
91
-
92
-
93
-
94
-
95
-
96
-
97
-
98
-
99
-
100
-
101
-
102
-
103
-
104
-
105
-
106
-
107
-
108
-
109
-
110
-
111
-
112
-
113
-
114
-
115
-
116
-
117
-
118
-
119
-
120
-
121
-
122
-
123
-
124
-
125
-
126
-
127
-
128
-
129
-
130
-
131
-
132
-
133
-
134
-
135
-
136
-
137
-
138
-
139
-
140
-
141
-
142
-
143
-
144
-
145
-
146
-
147
-
148
 |
 |

25
Item 7. Management’s Discussion and Analysis of Financial Condition and Results of Operations
Overview
Growth in the US economy proceeded at a moderately slow and uneven pace throughout 2015, resulting in 2.4% GDP
growth for the year with an initial estimate of 1.8% GDP growth in the fourth quarter of 2015 when compared to 2014.
Consumer spending remains the primary driver of growth in the economy, as the combination of low inflation, healthy
employment growth and a strong dollar have created a favorable environment for U.S. households. However, much of the
growth in consumer spending has been centered in the service sector and not in the manufacturing sector. Retail sales growth
was disappointing throughout most of 2015, and finished the year on a soft note with an underwhelming holiday season. E-
commerce has been one of the few bright spots for retailers, as growth in digital sales far outpaced traditional brick-and mortar
retailers. U.S. manufacturing continues to struggle, with weak export demand and sharp cutbacks in the mining sector
combining to curb domestic industrial production and investment spending in the economy. These conditions are likely to
continue in upcoming quarters, and growth is expected to remain fairly uneven in the economy as the bifurcation of the
economy continues through the first half of 2016. Given these trends, overall volume grew slowly during 2015, with those
products most aligned with the retail industry and e-commerce in particular experiencing the most growth.
Global GDP forecasts have been reduced in recent months, largely driven by growth concerns in emerging markets.
China’s economy continues to decelerate, particularly in the manufacturing sector, and recent financial market turmoil has
raised concerns that the pace of deceleration might be faster than initially expected. This in turn has driven down commodity
prices worldwide, and weakened the outlook for China’s major trading partners such as the EU and other emerging Asian
nations. The fall in commodity prices has negative implications for many other emerging economies, particularly in Latin
America and Russia, which rely on commodity exports to drive economic growth. Outside of emerging markets, growth in the
developed world appears to be continuing at a moderate pace, and advanced economies such as the many EU nations should
continue to experience solid growth in 2016. The uneven nature of economic growth worldwide, combined with a trend
towards more intra-regional trade, has continued the shifting of trade patterns and weakened demand in certain trade lanes. As a
result of these circumstances, we continued to adjust our air capacity and cost structure in our transportation network to better
match the prevailing volume levels. Our broad portfolio of product offerings and the flexibilities inherent in our transportation
network have helped us adapt to these changing trends.
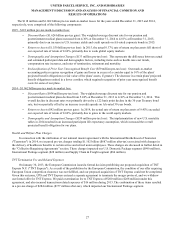
While the worldwide economic environment remained challenging in 2015, we have continued to undertake several
initiatives in the U.S. and internationally to (1) improve the flexibility and capacity in our transportation network; (2) improve
yield management; and (3) increase operational efficiency and contain costs across all segments. Most notably, the continued
deployment of technology improvements (including several facility automation projects and the accelerated deployment of our
On Road Integrated Optimization and Navigation system - "ORION") should increase our network capacity, and improve
operational efficiency, flexibility and reliability. Additionally, we have continued to utilize newly expanded operating facilities
to improve time-in-transit for shipments in each region.
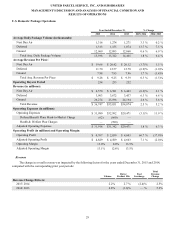
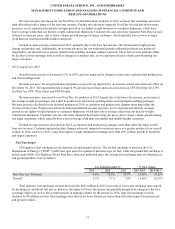
Our consolidated results are presented in the table below:
Year Ended December 31, % Change
2015 2014 2013 2015/ 2014 2014/ 2013
Revenue (in millions) $ 58,363 $ 58,232 $ 55,438 0.2 % 5.0 %
Operating Expenses (in millions) 50,695 53,264 48,404 (4.8)% 10.0 %
Operating Profit (in millions) $ 7,668 $ 4,968 $ 7,034 54.3 % (29.4)%
Operating Margin 13.1% 8.5% 12.7%
Average Daily Package Volume (in thousands) 18,324 18,016 16,938 1.7 % 6.4 %
Average Revenue Per Piece $ 10.37 $ 10.58 $ 10.76 (2.0)% (1.7)%
Net Income (in millions) $ 4,844 $ 3,032 $ 4,372 59.8 % (30.6)%
Basic Earnings Per Share $ 5.38 $ 3.31 $ 4.65 62.5 % (28.8)%
Diluted Earnings Per Share $ 5.35 $ 3.28 $ 4.61 63.1 % (28.9)%